
At a glance
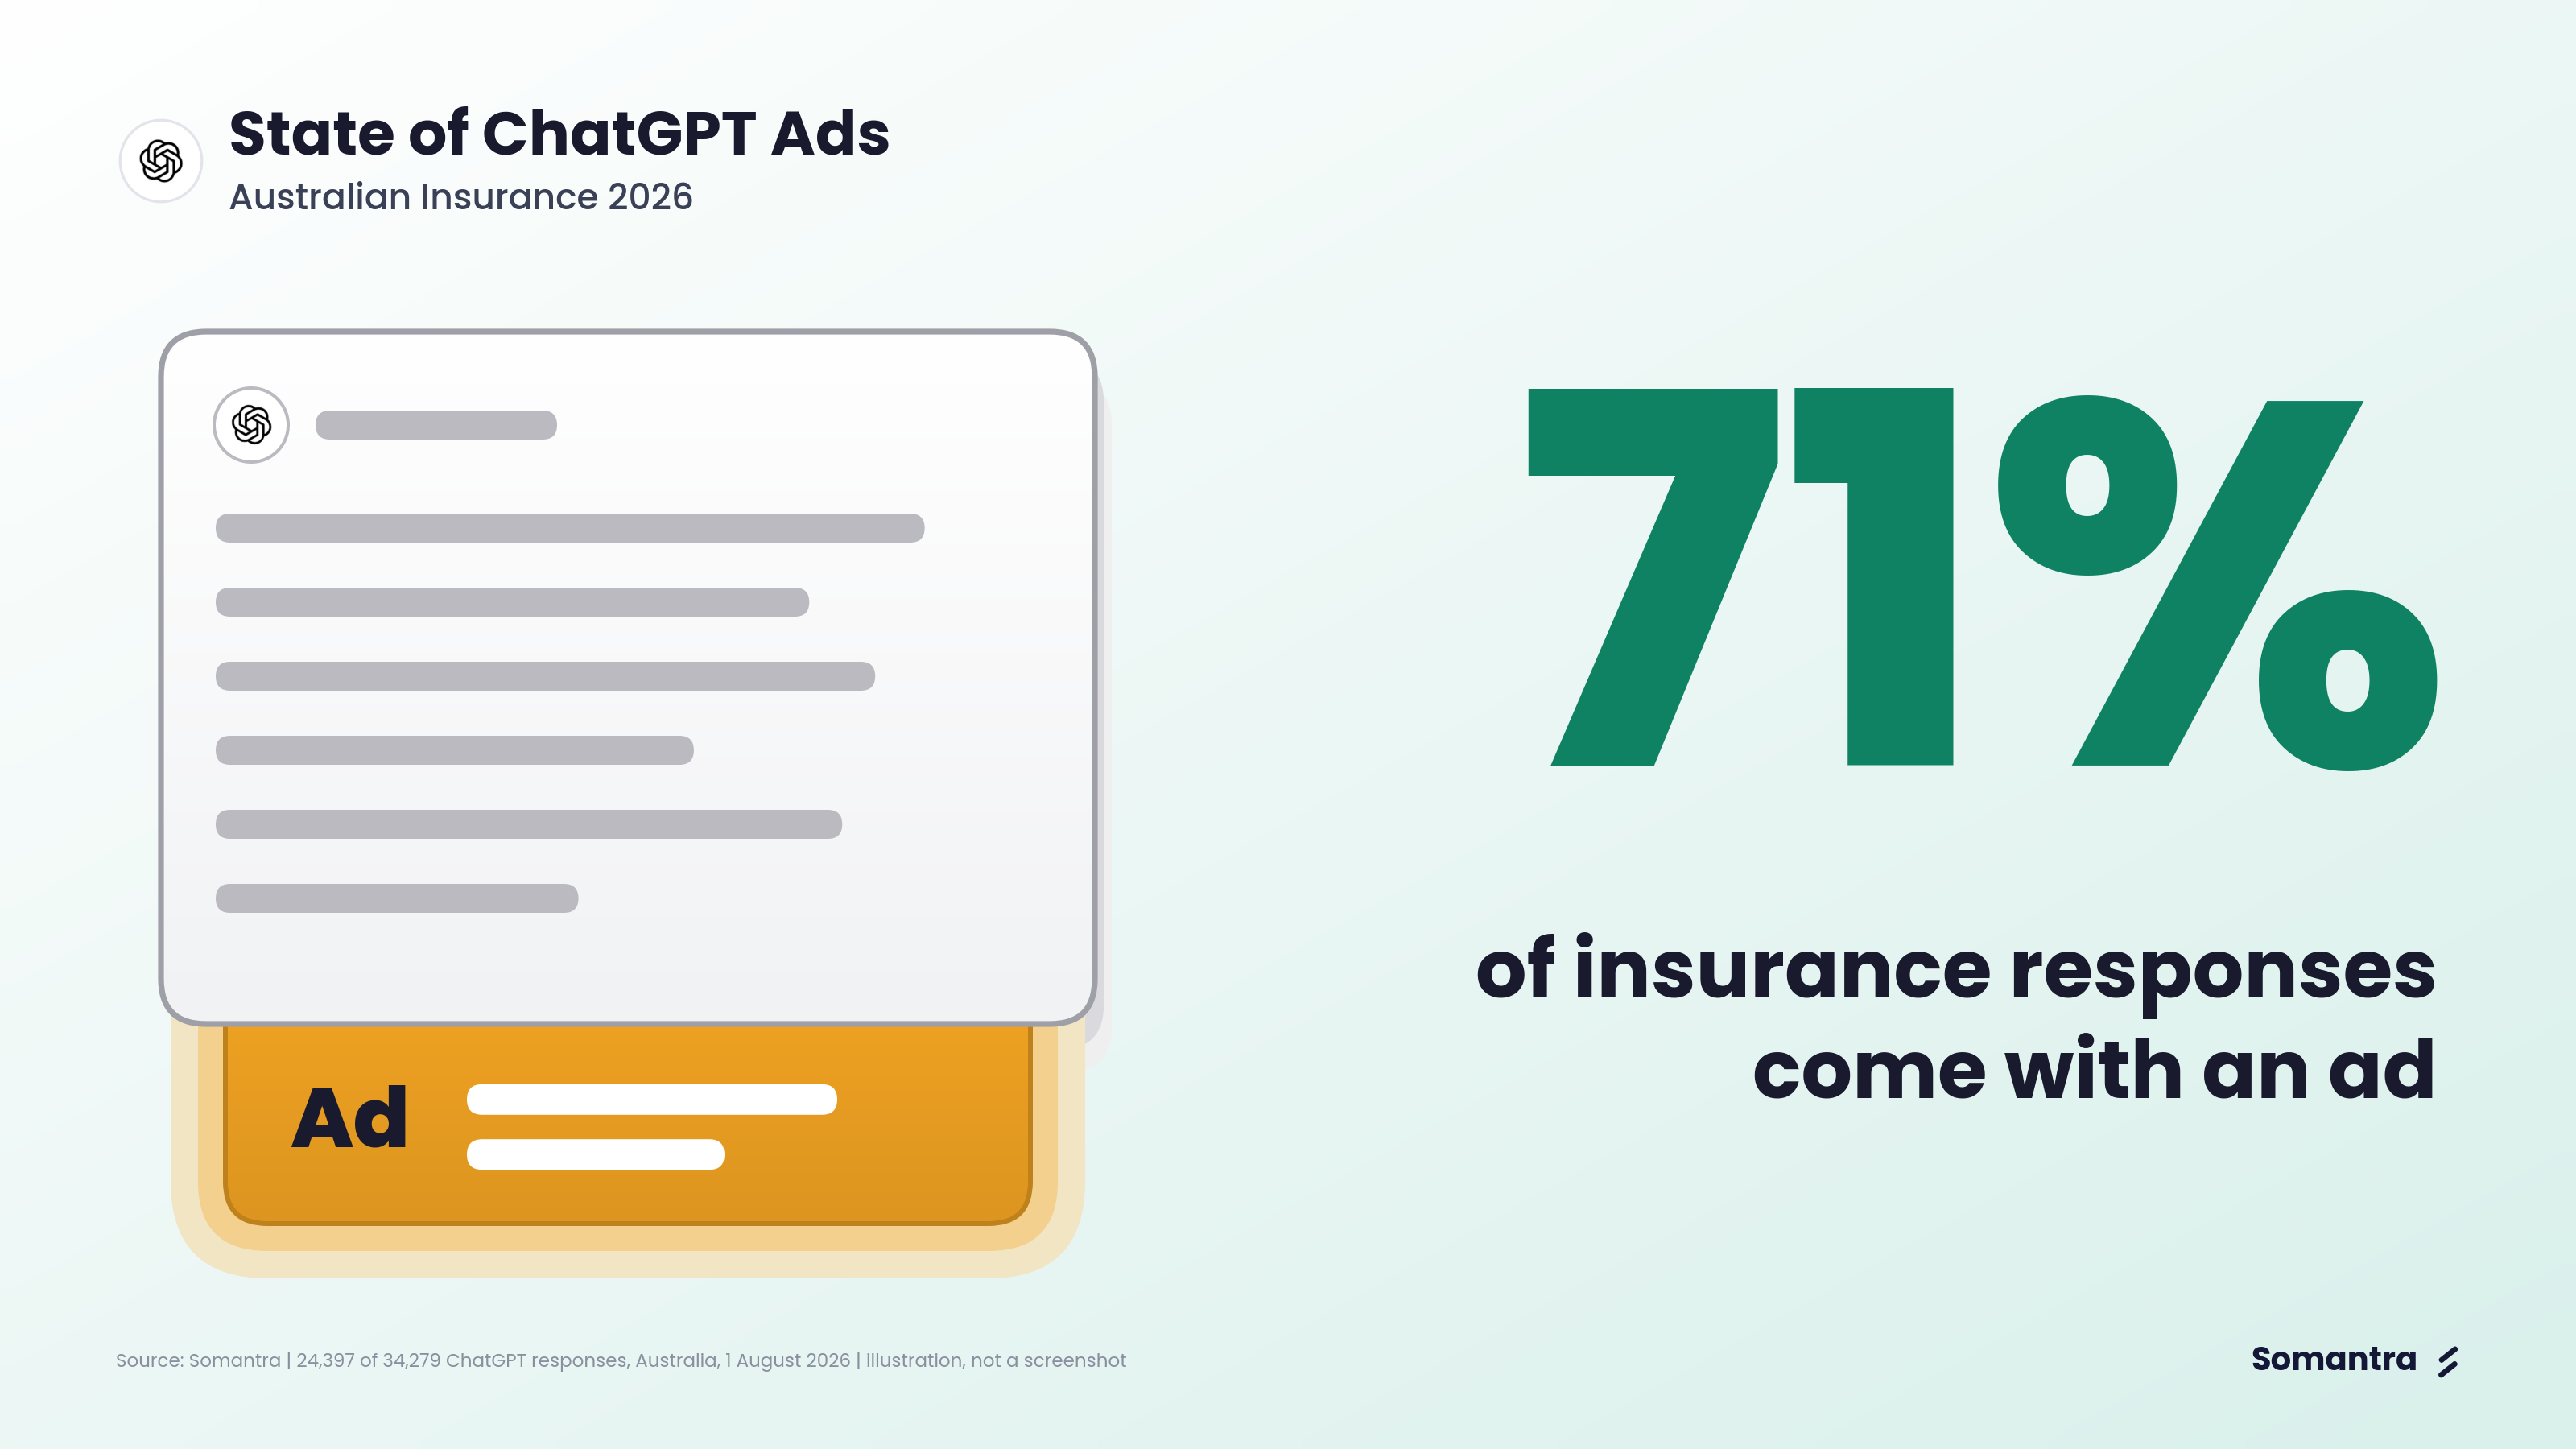
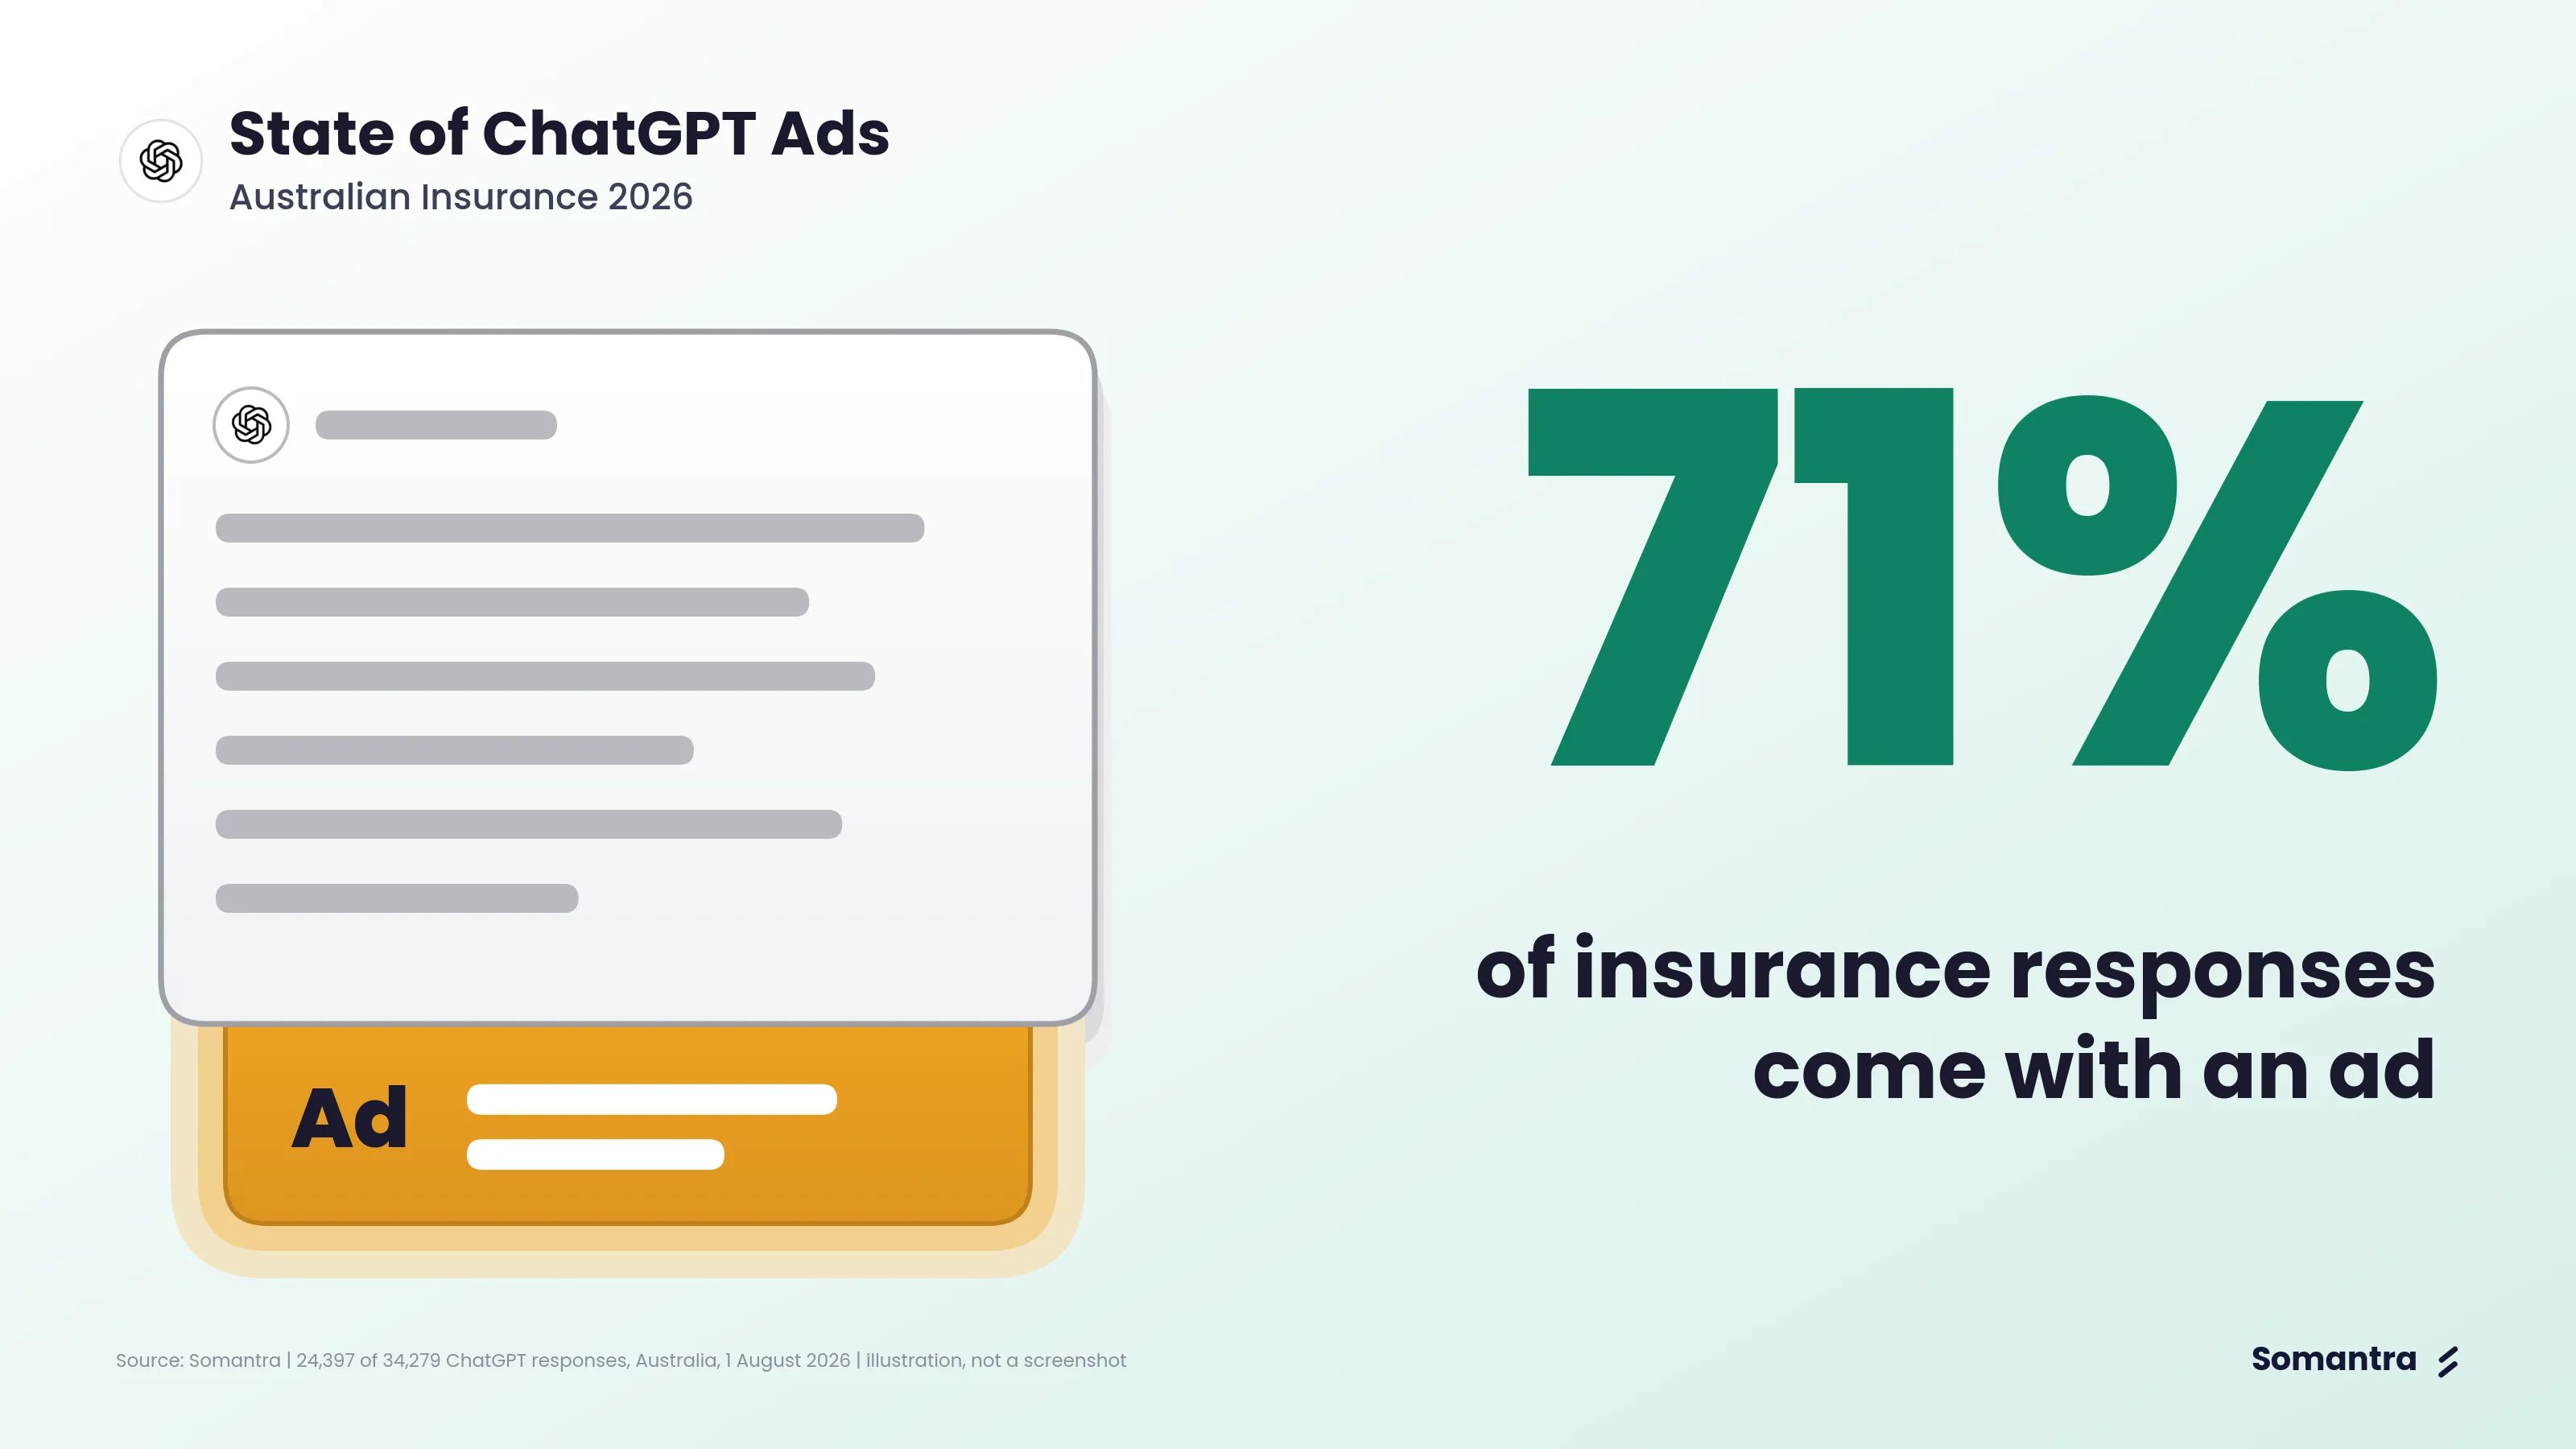
- Ads appear across every insurance category. Rates range from 66% to 79% of responses across the categories.
- Shopping language signal more ads. Queries using “best”, “top” or “recommended” are 8 percentage points more likely to have an ad. Those starting with “why” are 7 percentage points less likely. We audited this on two separate days, 1 and 3 August 2026.
- Ads give brands visibility where the response doesn’t mention them. In 85% of responses carrying a Budget Direct ad, the response itself does not mention Budget Direct.
- 67% of the ads are not for insurance. Software firms hold 27%, almost as much as the insurance sector’s 30%.
- Five advertisers account for 57% of ads: Budget Direct, Jotform, pdf.net, Consolidated Insurances and Finder. Another 327 advertisers share 11%.
- 55.5% of insurers’ ads offer a quote.
- Insurance advertisers rarely get the first mention. Just 1.5% of responses with an insurance ad mention one of those advertisers first.
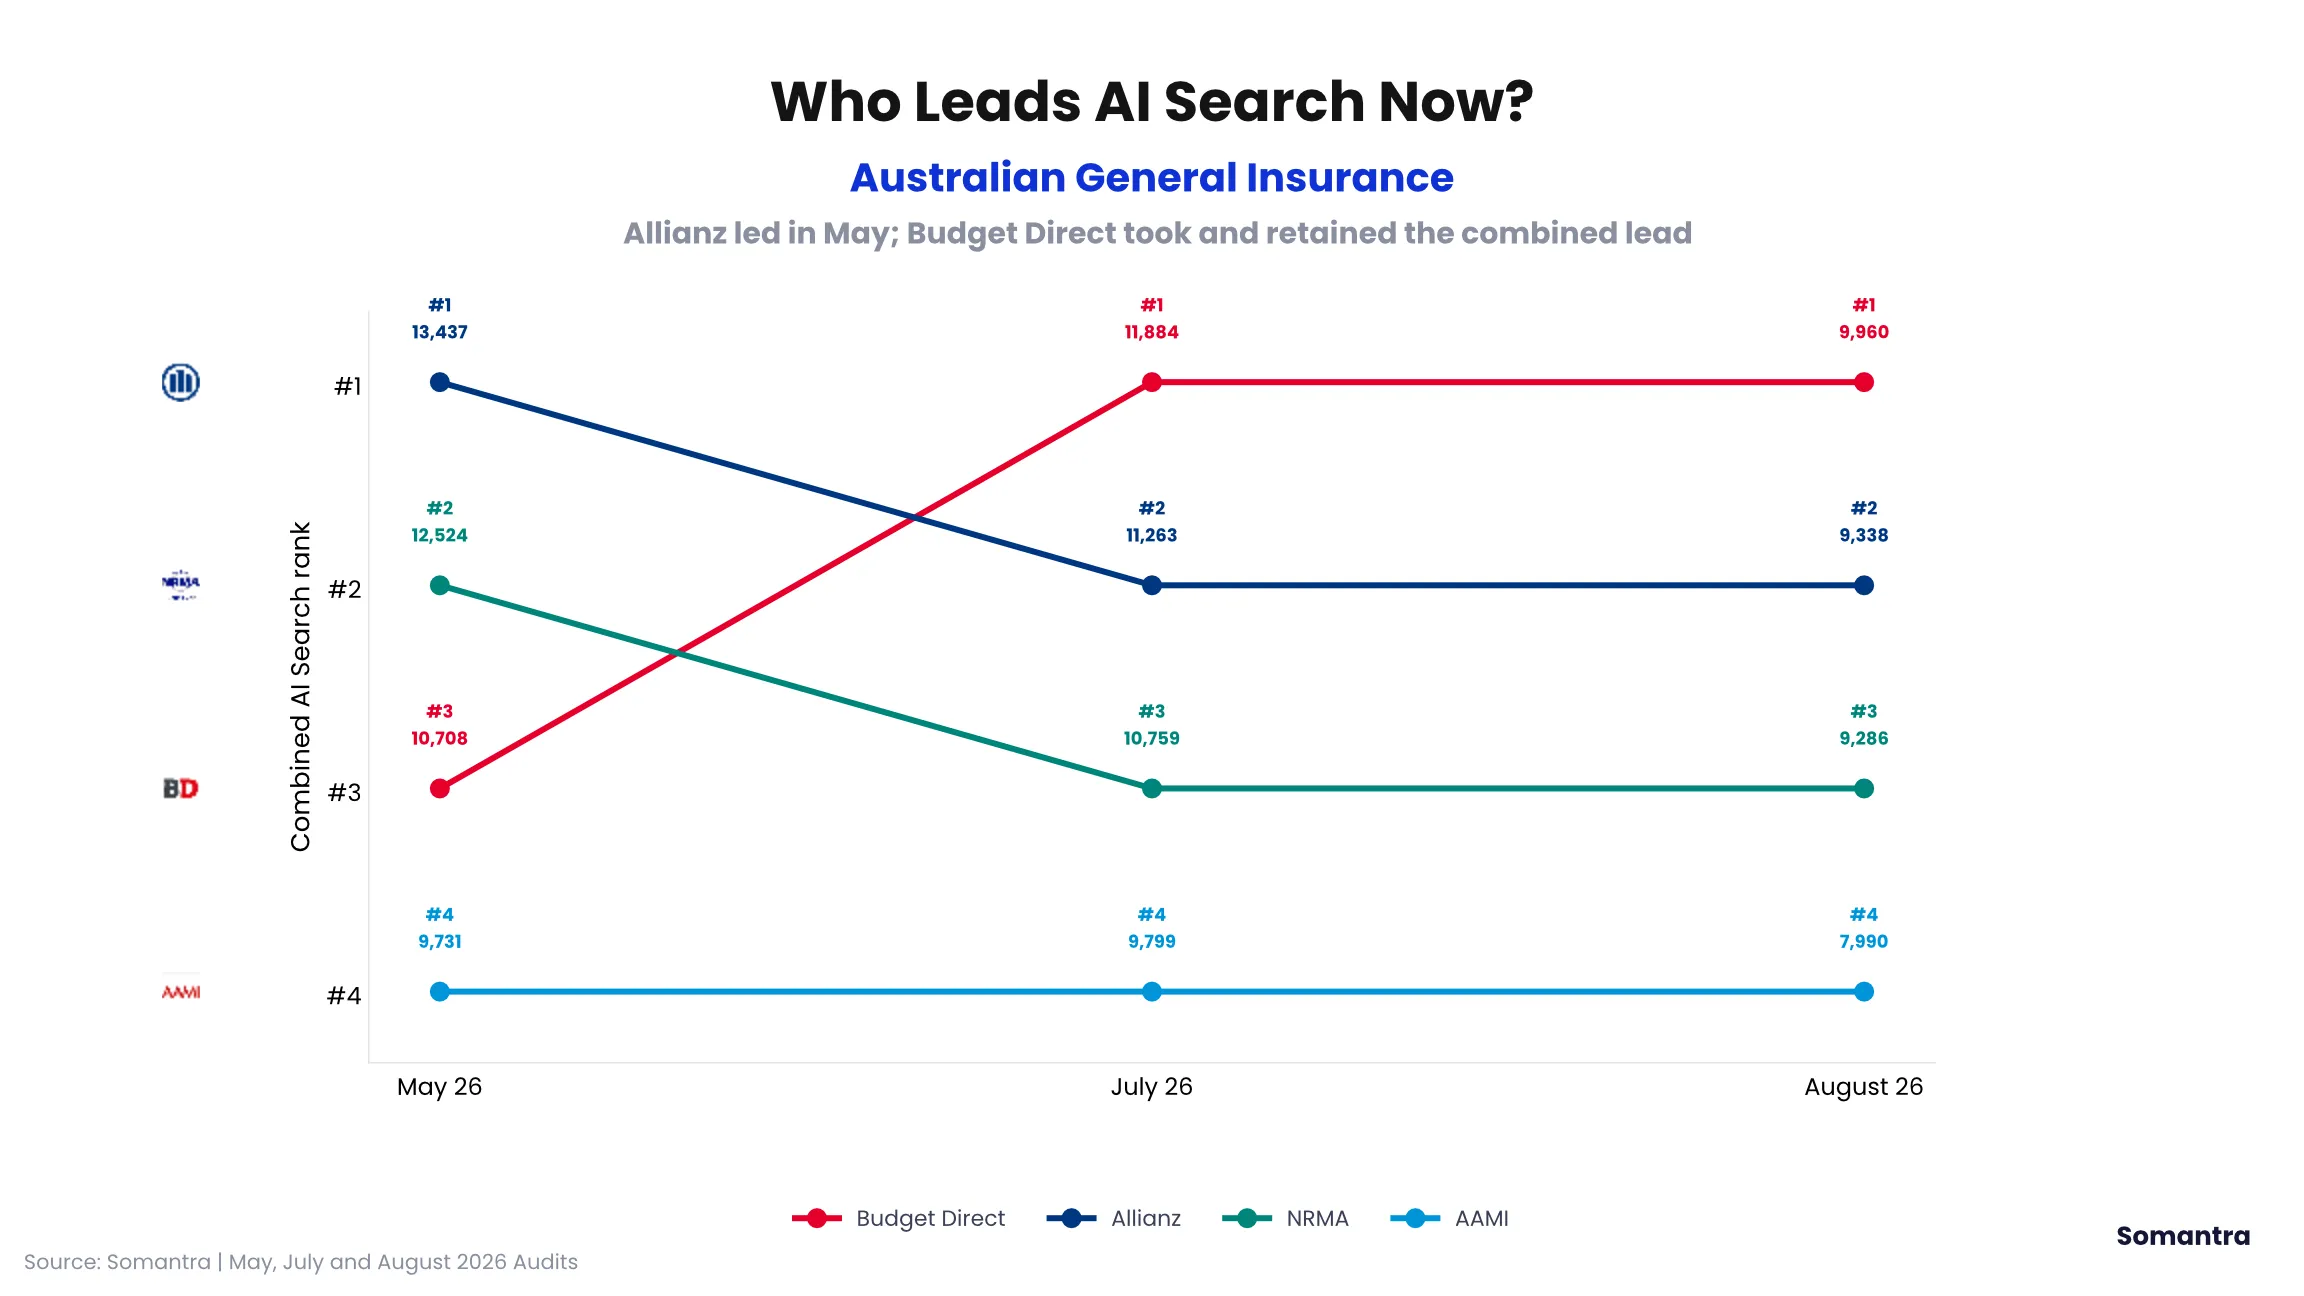
- Only 1 of the 20 tracked insurers has ads selling insurance. Budget Direct is the only one in this sample. Allianz, NRMA and AAMI, the insurers ChatGPT mentions most, have none.
- Non-insurers lead advertising in three categories. Jotform leads pet insurance queries, Visa leads travel, and Australian Retirement Trust leads life insurance, measured by ad count.
We report the ad rate three ways: 71% across all responses, about 76% once duplicate responses are removed (the base used from Section 3 onward), and 66% to 79% by insurance category. The de-duplicated figures run slightly higher because, where a query ran twice, we kept the response that carried an ad.
What this means
The same findings read differently depending on who you are.
If you are an insurer or insurance brand.
- Being recommended and being advertised are now two separate games, and most insurers are in neither. Only 1 of the 20 insurers we track runs ads that sell insurance, and the three insurers ChatGPT mentions most (Allianz, NRMA and AAMI) run none. The ad space beneath insurance answers is nearly empty of insurers, which makes it cheap to claim today.
- Ads let you appear where the answer never names you. Budget Direct’s ad sits under thousands of responses that do not mention Budget Direct (85% of its ad impressions). A rival being recommended in the text does not keep your ad off the same screen.
- Measure both surfaces. Track where you are mentioned and chosen inside the answer, and whether an ad, yours or a competitor’s, sits beneath it. This report shows the ad shelf is now as contested as the answer itself.
If you are a marketing or SEO agency.
- Ad presence under AI answers is a new, reportable surface for clients, separate from mentions and citations, and most competitors are not yet tracking it.
- Query wording shifts the odds. Shopping-intent queries (“best”, “top”, “recommended”) carry an ad about 8 points more often; explanation queries (“why”, “what is”) carry them less. Build client query sets that reflect how buyers actually ask.
- The field is open. 327 of the 371 advertisers run fewer than 100 ads each, and most insurers run none, so early movers can claim category ad space before it crowds.
If you advertise from outside insurance.
- Insurance answers are already low-cost attention. Software firms alone hold 27% of the ad impressions, almost matching the insurance sector’s 30%, and 67% of all ads are not for insurance.
- Match the ad and its landing page to the query. The advertisers with the closest fit (pets, travel and automotive) tailor each headline and page to the question asked; the off-topic ones mostly send traffic to a home page.
This covers two days of observation, 1 and 3 August 2026. It shows what the ad shelf looked like, not how any business should price or plan a campaign.
What we looked at
On 1 and 3 August 2026 we asked ChatGPT 34,279 queries about insurance in Australia. No queries mentioned an insurer. Under the responses ChatGPT showed 35,290 ads from 371 advertisers.
Ads sit below the response and are separate from its text. We can therefore compare the businesses mentioned in the response with the advertisers shown below it.
Throughout this report, an “ad” means one recorded appearance. The same ad shown under ten responses counts as ten ads. An “insurance ad” means an ad selling insurance, whether it comes from an insurer, broker or comparison site. “Insurer ads” means ads from businesses classified as insurers. These groups differ: for example, RACV’s five ads promote resorts, not insurance.
1. Most insurance answers carry an ad, and a few advertisers dominate
71% of insurance responses have ads
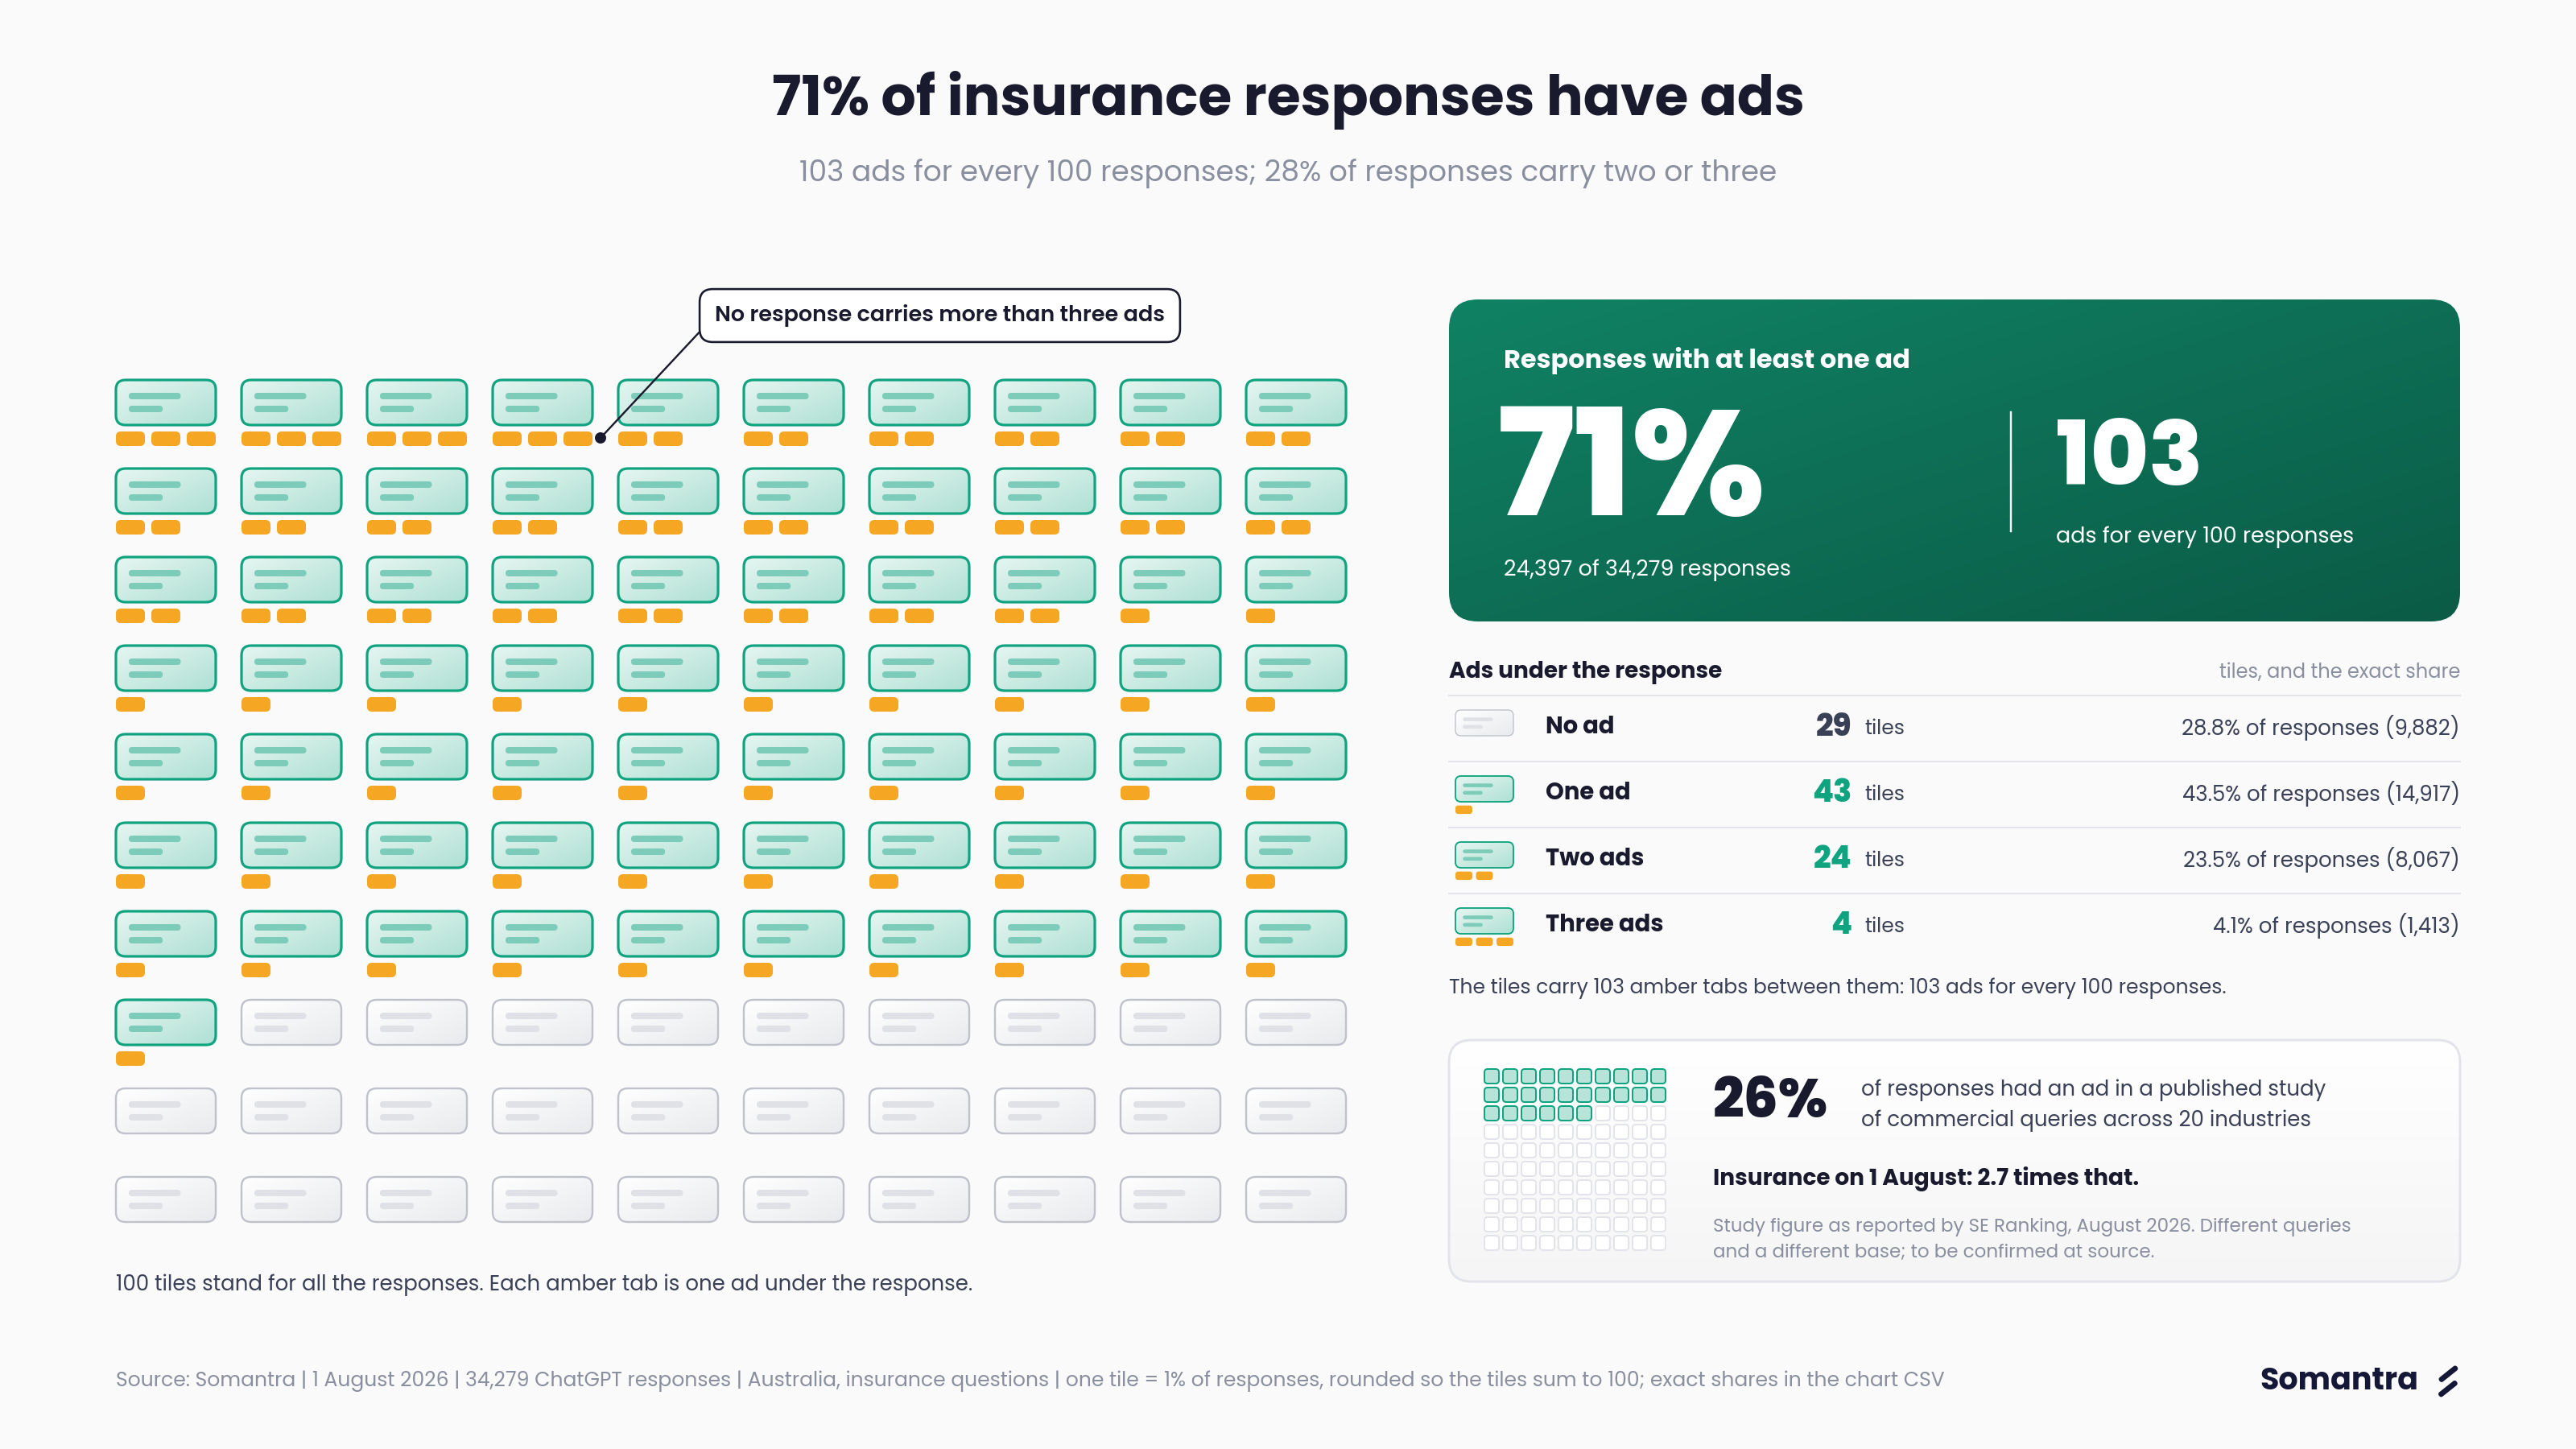
24,397 of the 34,279 responses carry at least one ad.
- There are 103 ads for every 100 responses.
- 28% of responses carry two or three ads. No response carries more than three.
- A published study of commercial queries across 20 industries reported an ad on 26% of responses. Insurance runs at nearly three times that. (Study figure as reported by SE Ranking, August 2026; to be confirmed at source before publication.)
| Ads under the response | Share of responses |
|---|---|
| None | 28.8% |
| One | 43.5% |
| Two | 23.5% |
| Three | 4.1% |
Five advertisers hold 57% of the ads
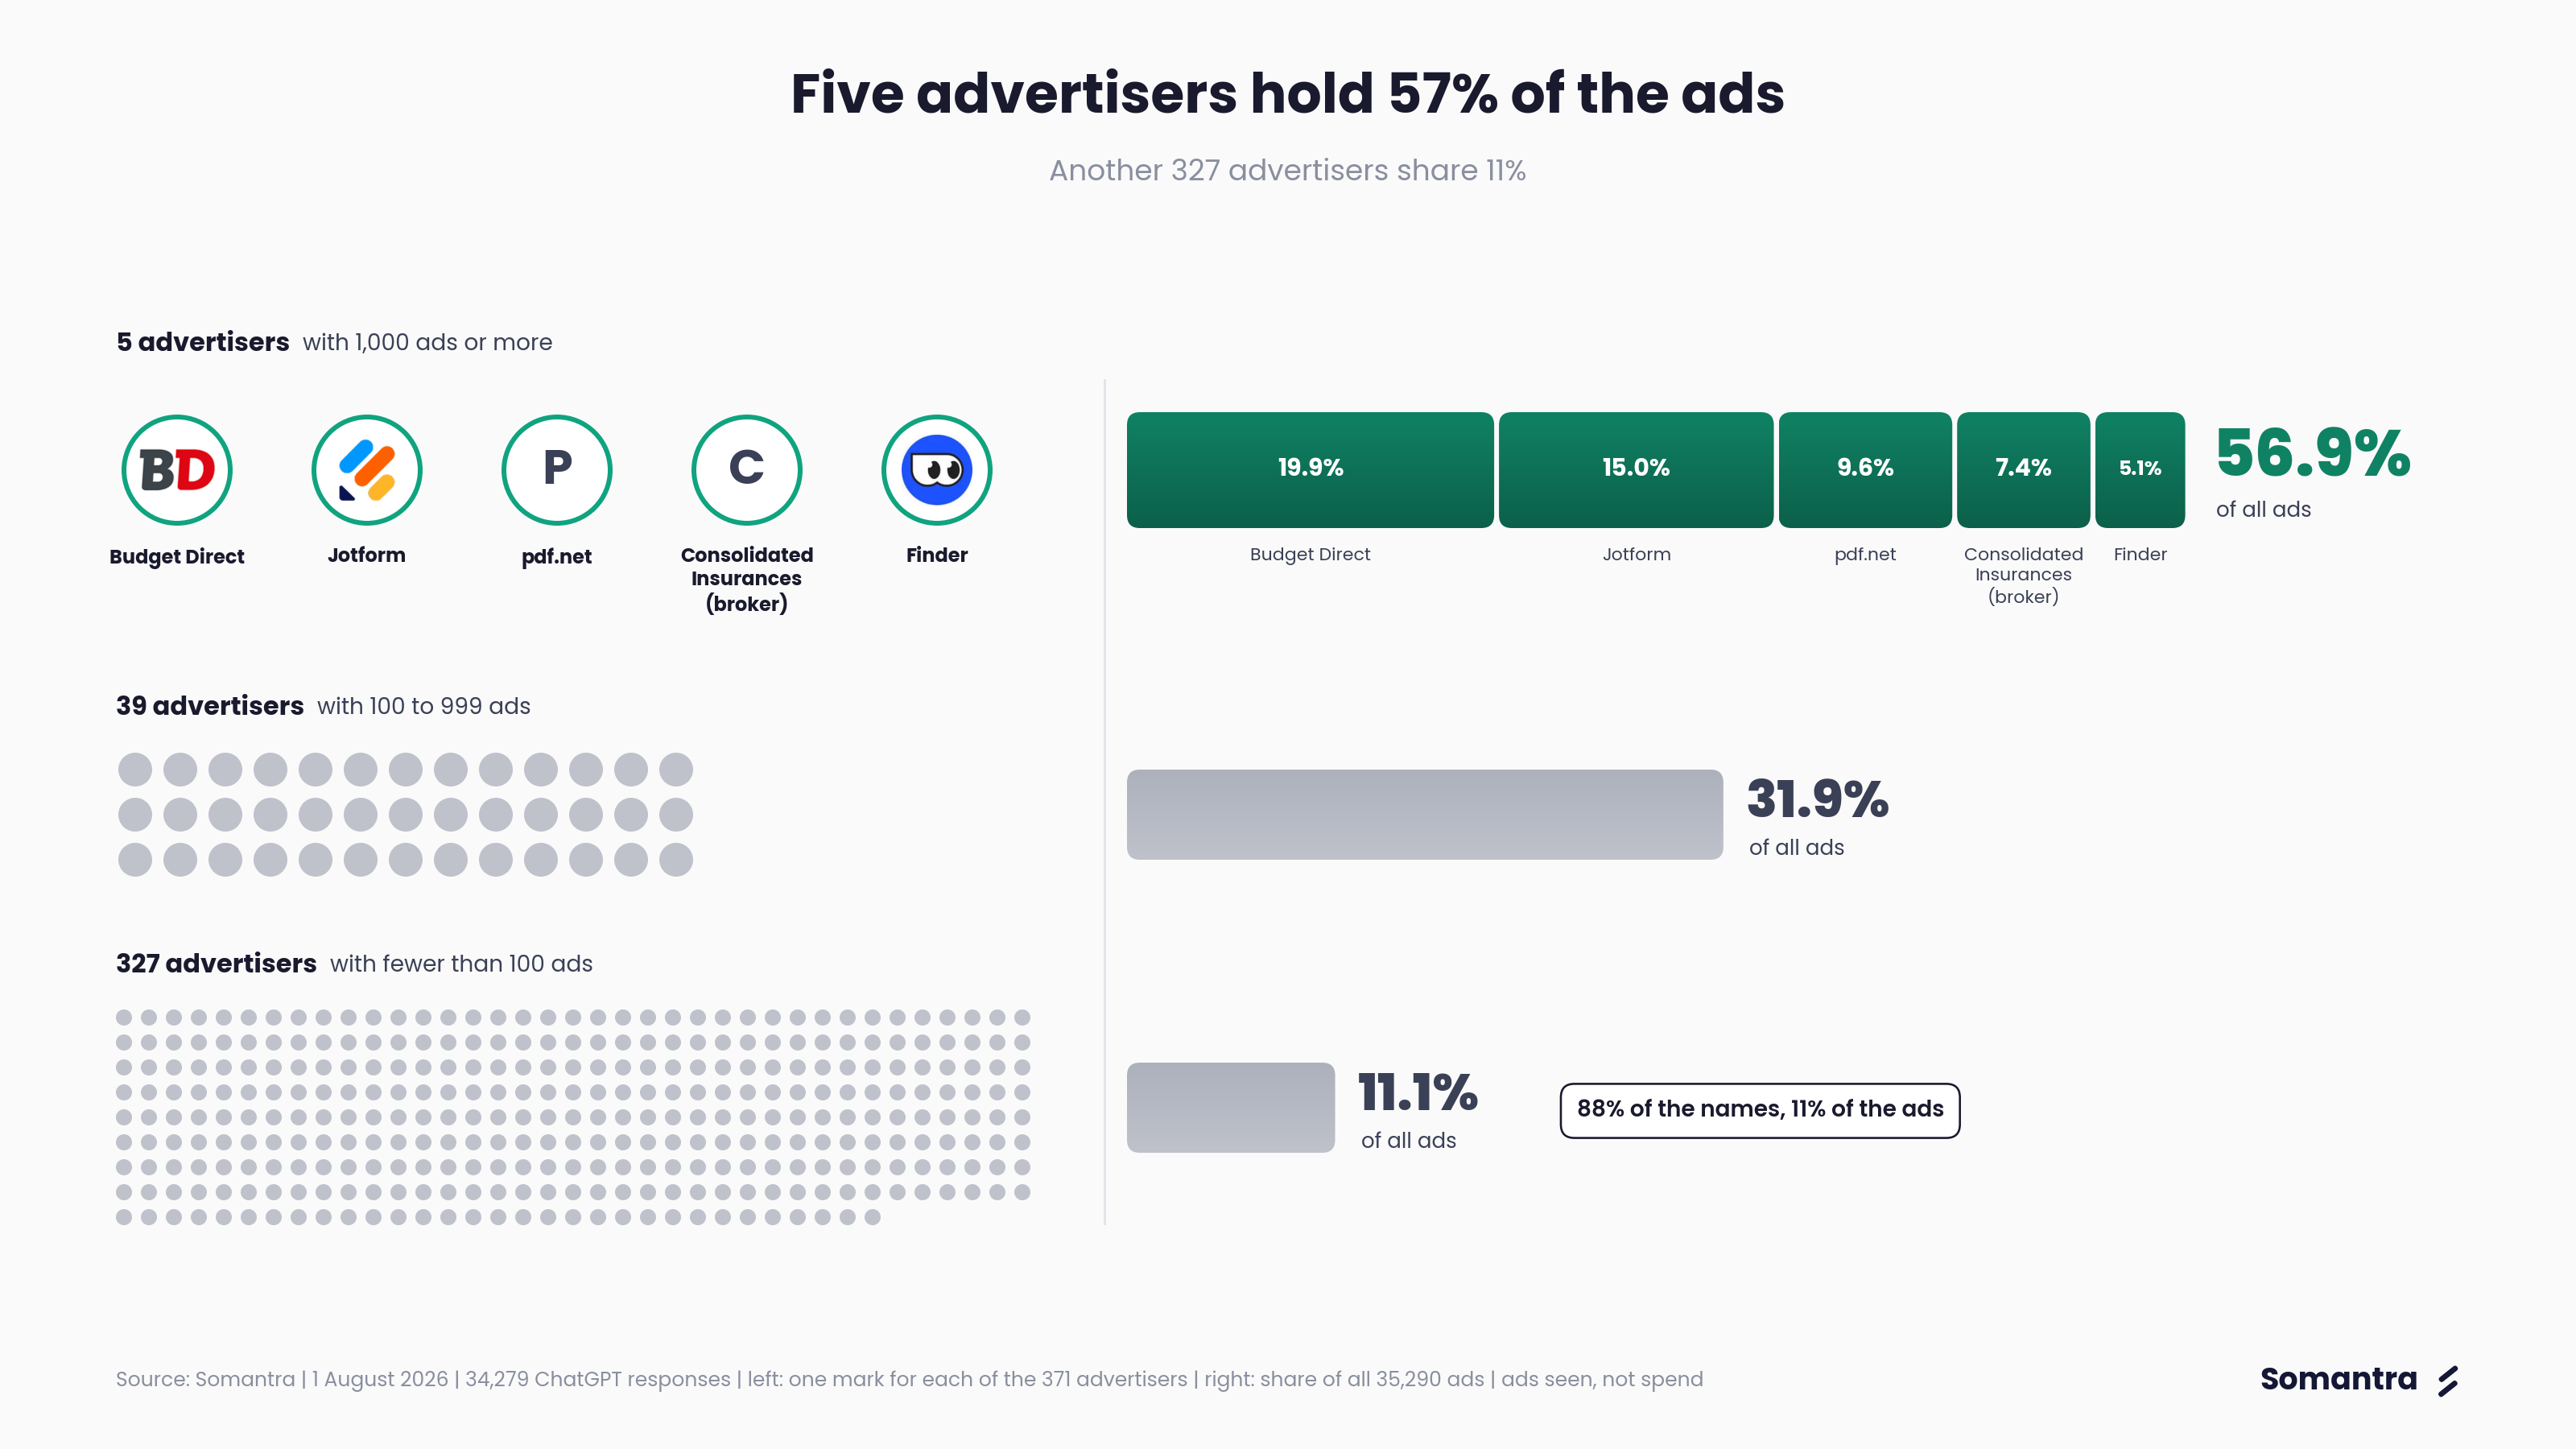
| Advertiser | What it is | Ads | Share of all ads |
|---|---|---|---|
| Budget Direct | Insurer | 7,029 | 19.9% |
| Jotform | Form builder | 5,285 | 15.0% |
| Variant Group (pdf.net) | PDF tool | 3,372 | 9.6% |
| Consolidated Insurances | Insurance broker | 2,611 | 7.4% |
| Finder | Comparison site | 1,791 | 5.1% |
Ranked by number of ads seen. We cannot see what anyone spent.
Most other advertisers appear much less often.
| Advertisers with | How many | Share of all ads |
|---|---|---|
| 1,000 ads or more | 5 | 56.9% |
| 100 to 999 | 39 | 31.9% |
| 10 to 99 | 95 | 9.1% |
| 2 to 9 | 143 | 1.8% |
| 1 ad | 89 | 0.3% |
- 327 of the 371 advertisers have fewer than 100 ads each. That is 88% of the names and 11.1% of the ads.
- One or two advertisers account for most ads in some sectors: insurance, software, comparison sites, super and payments.
- Other sectors have more advertisers sharing the ads: it takes 8 advertisers to reach 80% of automotive ads, 11 for home and property, 7 for travel.
- Many small advertisers are local. 55 mention a city or state: Sydney removalists, Perth security firms, regional car dealers, trades.
- 26 are overseas businesses, including insurance businesses from the United States and Canada.
- Small advertisers are off-topic more often than large ones in the same sector: 33.2% against 18.2% in home and property, 9.7% against 3.9% in travel.
2. Every insurance type draws ads, and in pet, travel and life the top advertiser is not an insurer
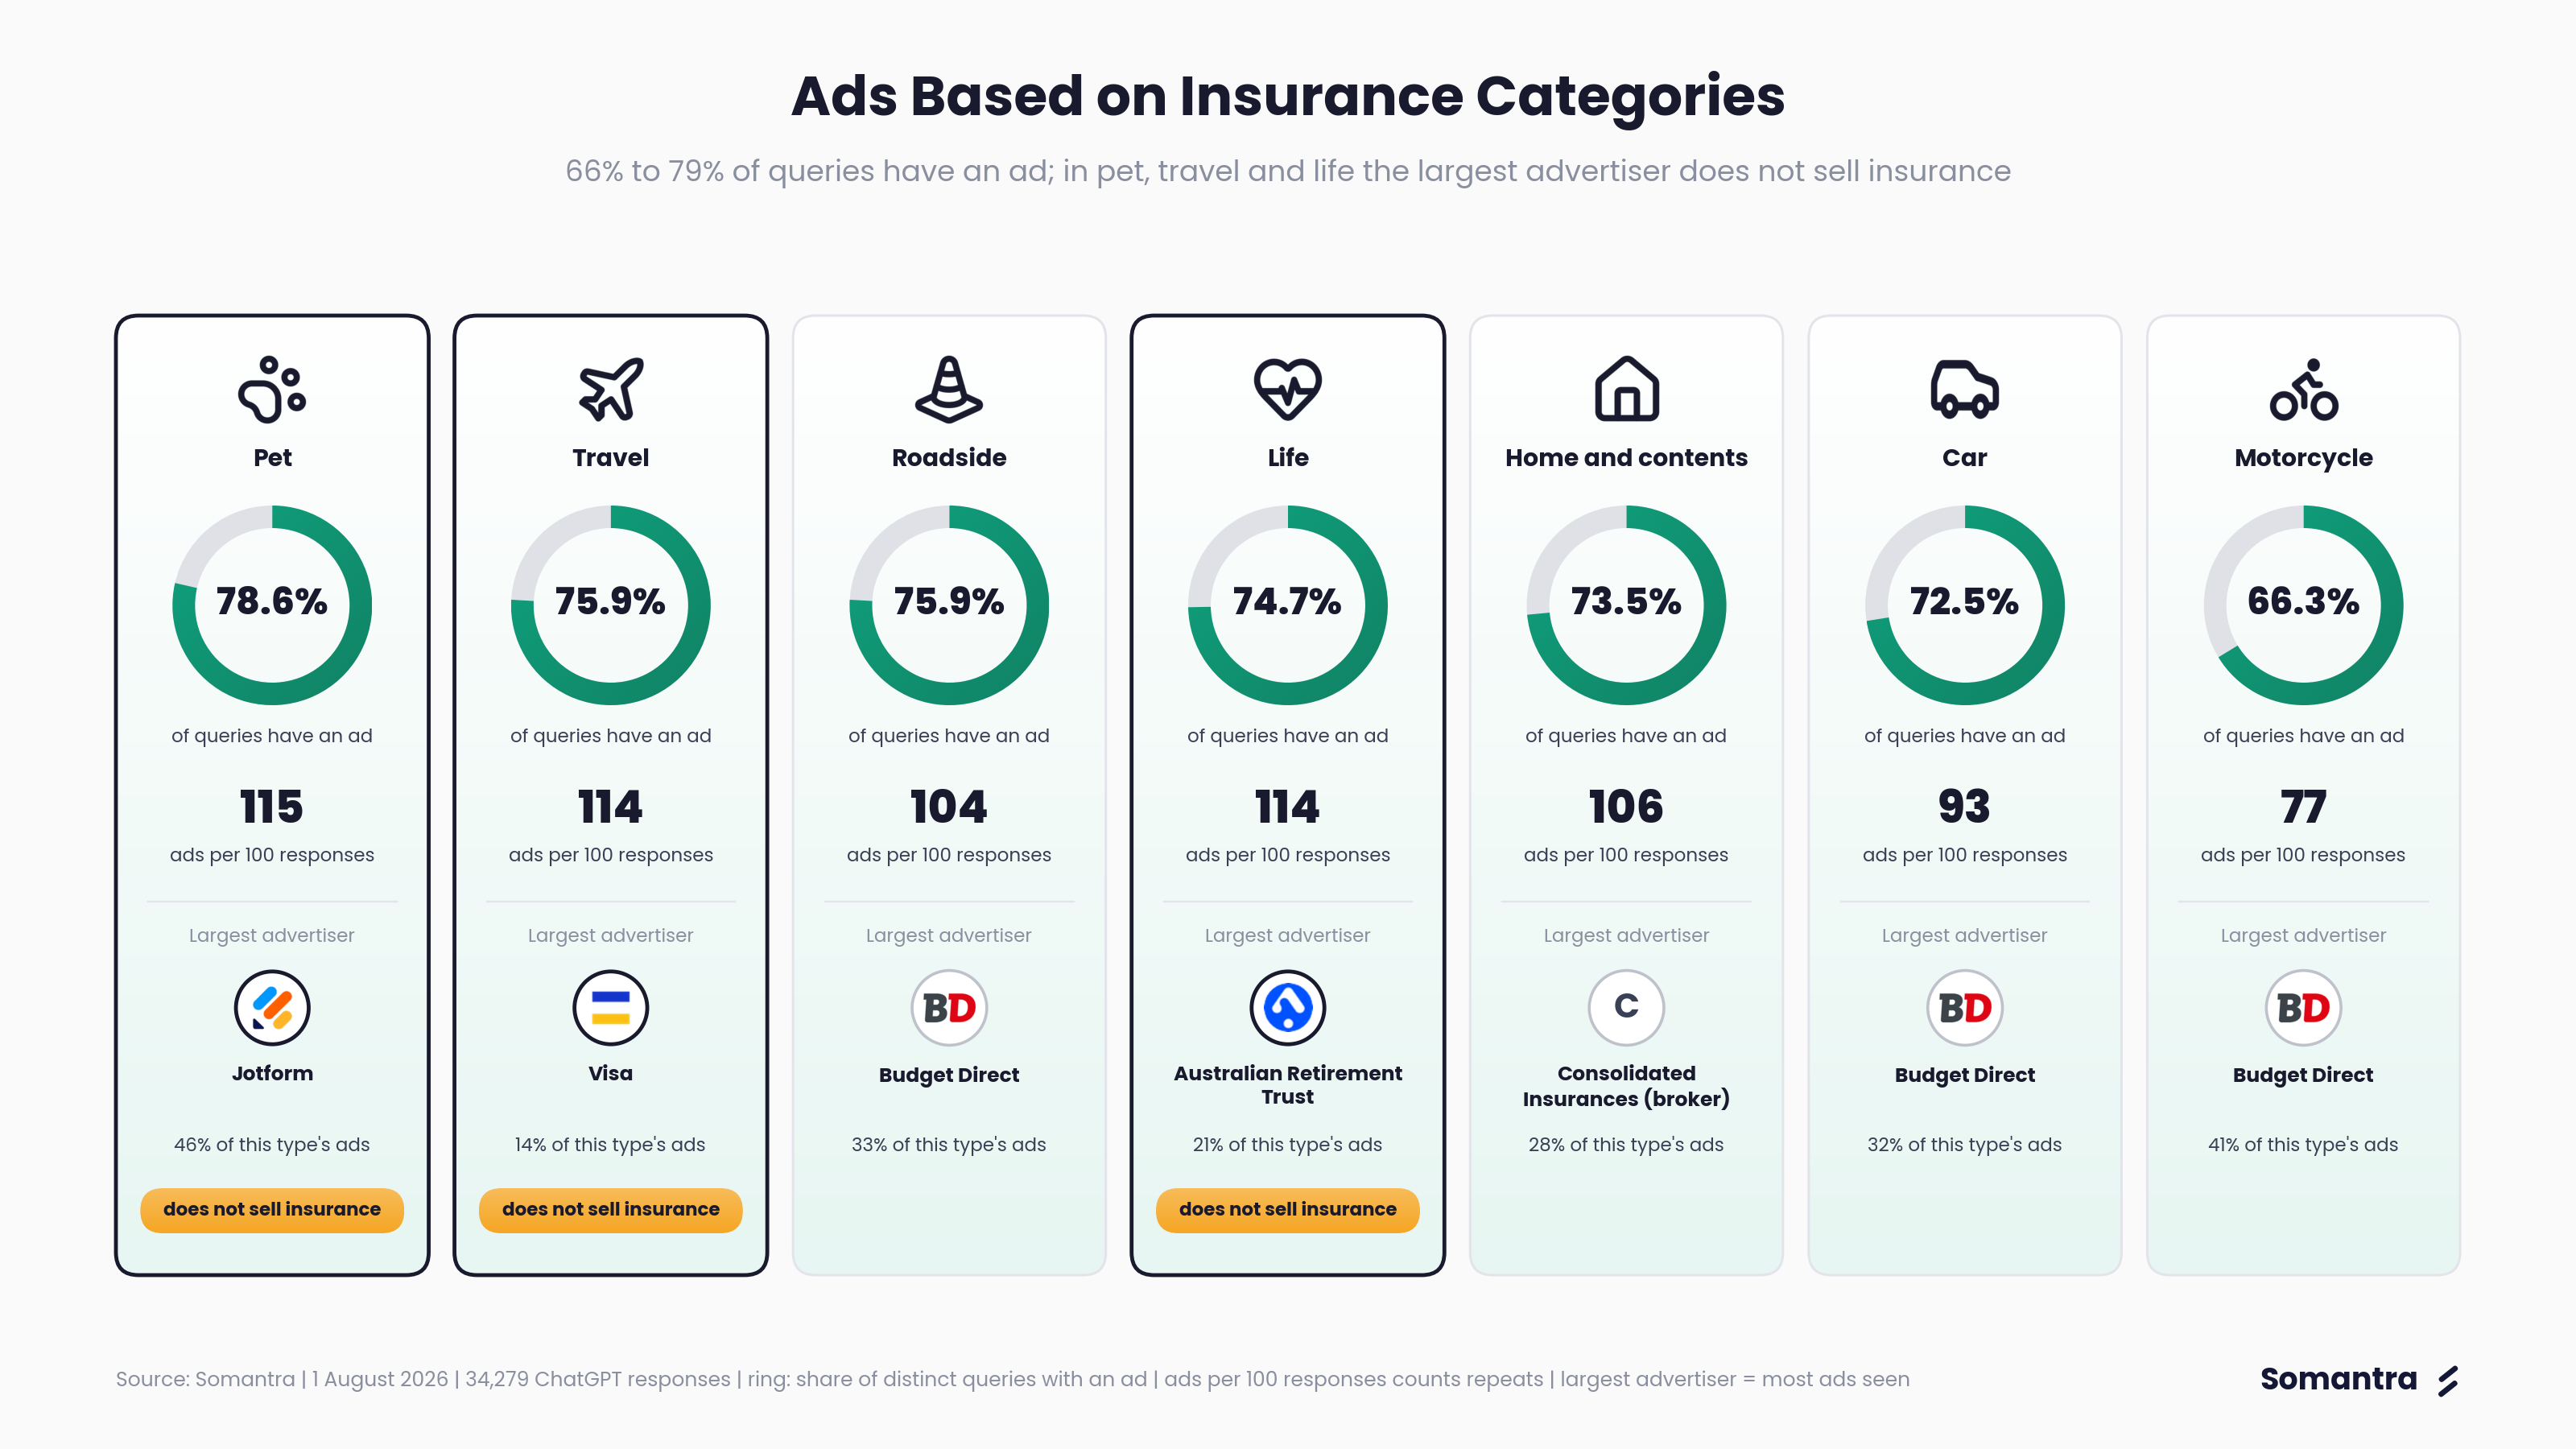
When repeated queries are counted once, no type of insurance falls below 66%. This differs from the 71% headline rate, which counts every response, including repeated queries.
| Type of insurance | Queries with an ad* | Ads per 100 responses | Largest advertiser |
|---|---|---|---|
| Pet | 79% | 115 | Jotform (form builder) |
| Travel | 76% | 114 | Visa |
| Roadside | 76% | 104 | Budget Direct |
| Life | 75% | 114 | Australian Retirement Trust |
| Home and contents | 73.5% | 106 | Consolidated Insurances (broker) |
| Car | 73% | 93 | Budget Direct |
| Motorcycle | 66% | 77 | Budget Direct |
*The ad-rate column counts each distinct query once. “Ads per 100 responses” counts all responses, including repeats. “Largest advertiser” means the one with the most recorded ads.
- In pet, travel and life insurance, the largest advertiser is not an insurer.
- Broad queries do not get more ads overall than detailed queries. But they more often get ads selling insurance: 38% of broad queries about choosing insurance have one, compared with 31% of detailed queries.
3. Shopping words draw more ads; “why” and “what is” draw fewer
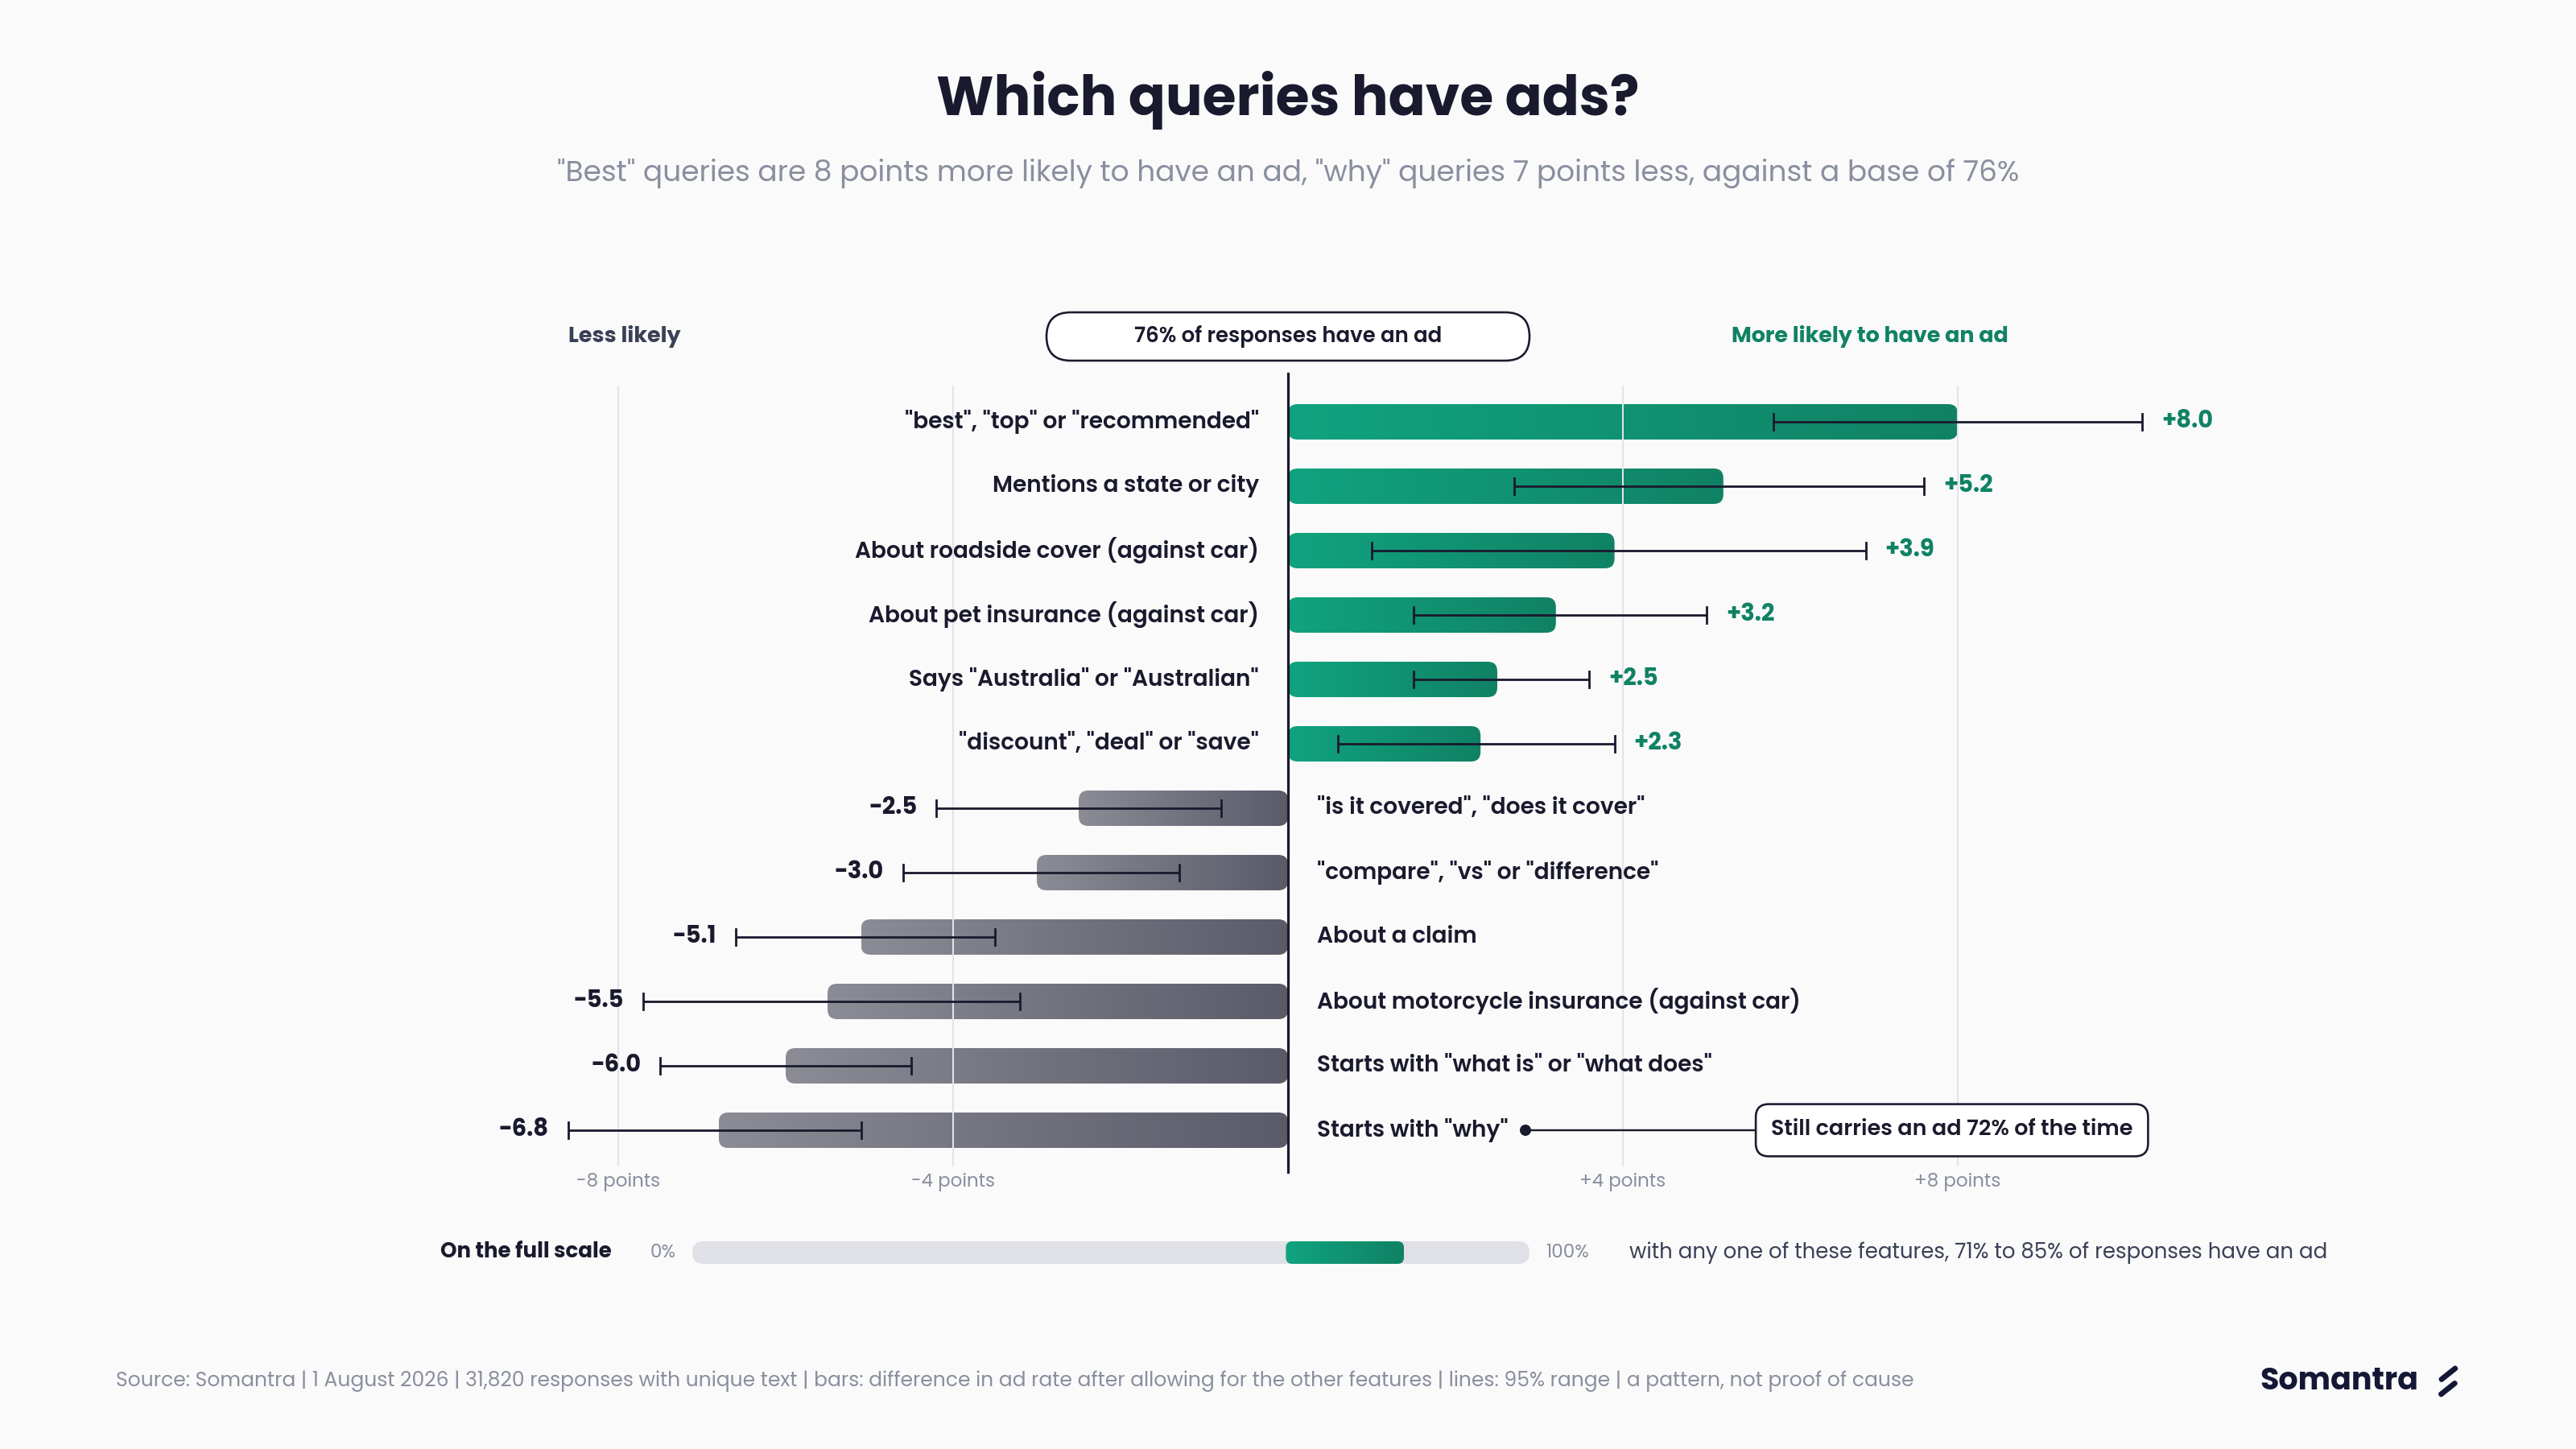
We checked which query features were linked to ads appearing. This analysis uses 31,820 responses after collapsing repeated queries into one response each. Some queries were run twice: where that happened we kept the response that carried an ad, and if neither run had an ad we kept the one run last. Of these 31,820 responses, 76% carry an ad.
This 76% is the base rate for a typical query, and it sits a little above the 71% headline because the rule above favours the ad-bearing response when a query was repeated. Read the table below against this base: the “without the feature” column stays near 76% because each feature is only a small share of all queries, while the “with the feature” column shows how that feature moves the rate. Queries using “best”, “top” or “recommended”, for example, carry an ad 85% of the time, not 76%.
| Feature of the query | Responses with this feature | Ad rate: with / without the feature | Adjusted difference in ad rate |
|---|---|---|---|
| ”best”, “top” or “recommended” | 1,909 | 85%, 76% | +8.0 points |
| Mentions a state or city | 1,283 | 81%, 76% | +5.2 |
| About roadside cover (against car) | 1,062 | 79%, 76% | +3.9 |
| About pet insurance (against car) | 4,244 | 80%, 76% | +3.2 |
| Says “Australia” or “Australian” | 10,854 | 79%, 75% | +2.5 |
| ”discount”, “deal” or “save” | 4,880 | 79%, 76% | +2.3 |
| ”is it covered”, “does it cover” | 2,914 | 73%, 77% | -2.5 |
| ”compare”, “vs” or “difference” | 3,113 | 74%, 77% | -3.0 |
| About a claim | 4,686 | 72%, 77% | -5.1 |
| About motorcycle insurance (against car) | 2,770 | 71%, 77% | -5.5 |
| Starts with “what is” or “what does” | 7,686 | 73%, 77% | -6.0 |
| Starts with “why” | 3,624 | 72%, 77% | -6.8 |
Read this as: almost every query carries an ad. Wording nudges the odds a few points either way, but never far from the 76% base.
The middle column shows the observed rates. The last column estimates the difference after accounting for other measured query features, so it is not a subtraction of the two rates. Differences are in percentage points: a rise from 76% to 84% is 8 points. All listed differences passed our statistical checks, but that does not prove the wording caused them.
- Shopping words go with more ads. Queries using “best”, “top” or “recommended” have an adjusted ad rate 8 points higher. Mentioning a state or city is linked to a 5-point higher rate.
- Queries asking for explanations or about claims have fewer ads. The adjusted rate is 7 points lower for “why”, 6 for “what is” or “what does”, and 5 for claims queries.
- The differences are small against a base of 76%. Even “why” queries carry an ad 72% of the time.
- Query features explain little overall. The features we tested do a poor job of separating responses with ads from those without them.
- No clear link to ad presence: “quote”, “price” or “cost”, “buy” or “apply”, the length of the query, life events, illness, legal, disaster and theft topics.
This is about whether any ad appears. It says nothing about which advertiser.
4. Adding “best” or “cheap” makes an ad more likely to appear
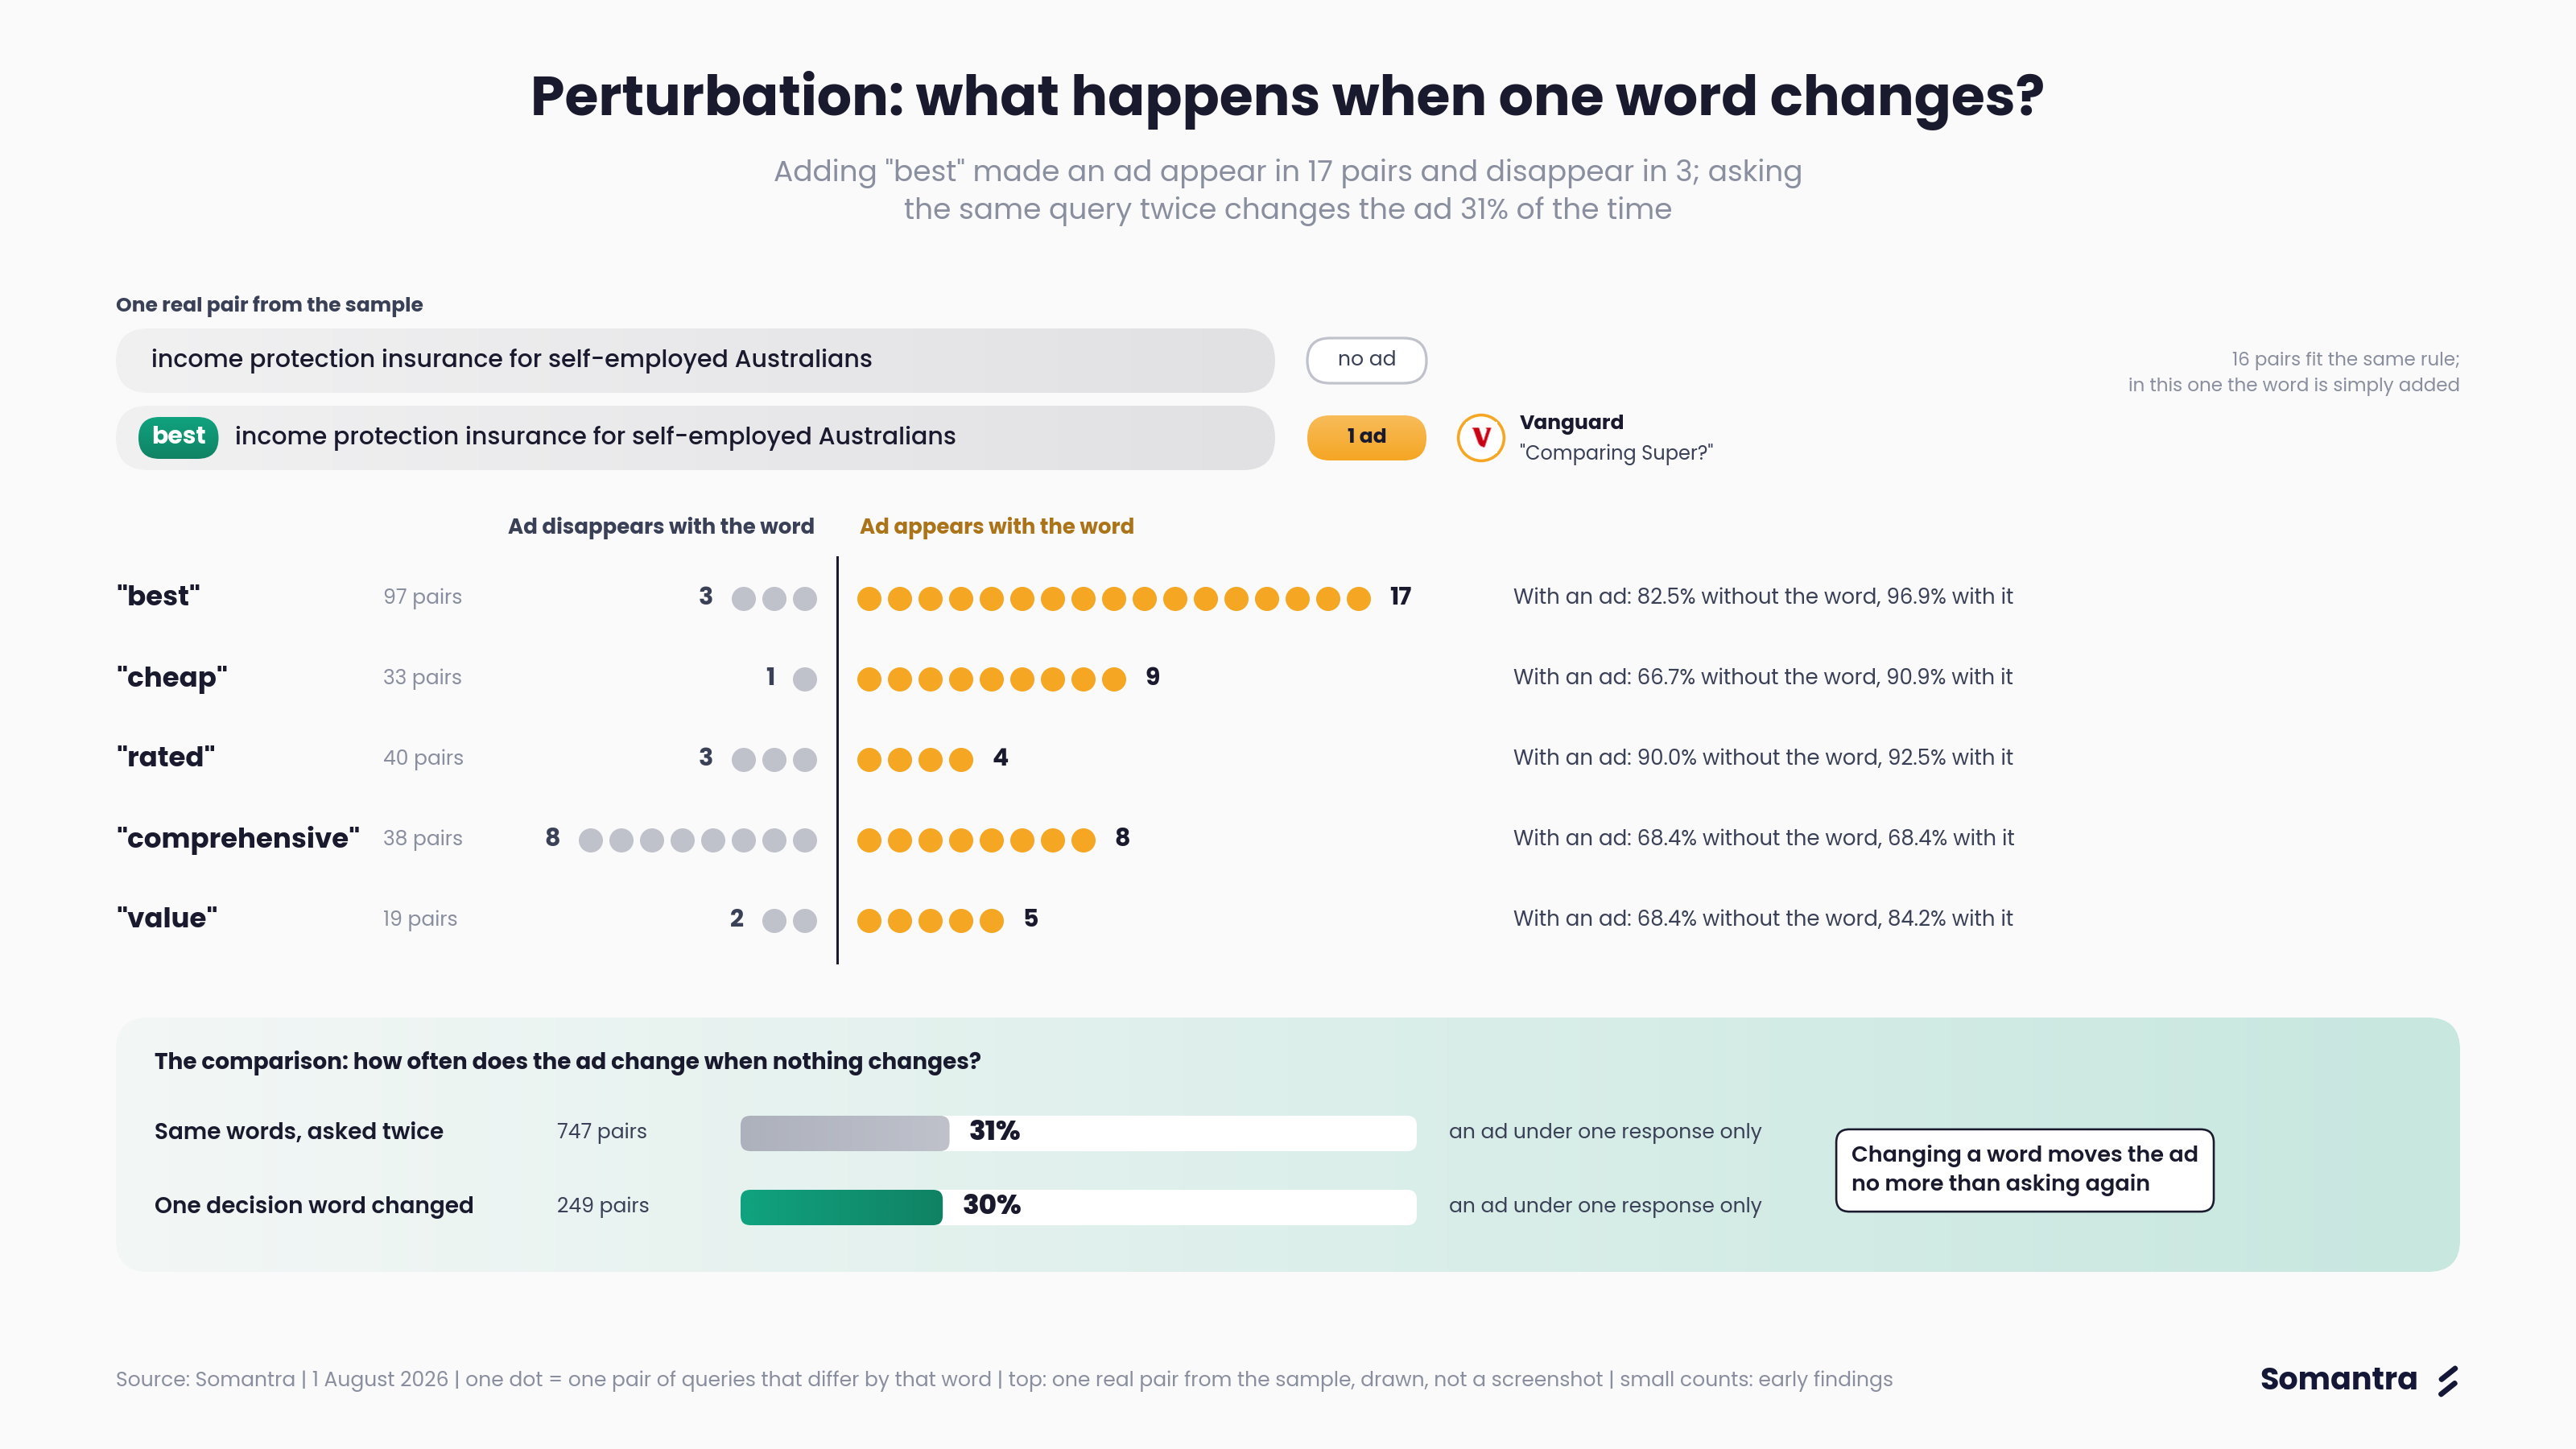
A perturbation is a small change to a query. We compared pairs of queries that differ by one word. This lets us check whether ads appear more often with one wording than another. For how a single word reshapes the answer itself, not just the ads beneath it, see our companion study on how one word can reposition a brand in AI search.
First, we need a comparison. In the repeated-query group, an ad appears under one response and not the other 31% of the time. A wording change must be assessed against this normal variation. This group matches queries with the same words, even if their order differs.
| Pair of queries | Pairs | Ad under one response only | Both have ads: same first advertiser |
|---|---|---|---|
| Same words, asked twice (comparison) | 747 | 31% | 33% |
| One small word changed (“a”, “the”, “in”) | 208 | 22% | 39% |
| One decision word changed (“best”, “cheap”, “rated”) | 249 | 30% | 29% |
| Any other single word changed | 11,017 | 36% | 29% |
Changing a shopping word, such as “best” or “cheap”, gives a similar rate of ad changes to asking again: 30% against 31%. A second comparison includes words added as well as swapped. In those pairs, ads appear more often with the shopping word.
| Word added or swapped in | Pairs | With an ad: without the word, with it | Ad appears | Ad disappears |
|---|---|---|---|---|
| All decision words | 281 | 77%, 89% | 57 | 22 |
| ”best” | 97 | 82.5%, 96.9% | 17 | 3 |
| ”cheap” | 33 | 67%, 91% | 9 | 1 |
| ”rated” | 40 | 90%, 93% | 4 | 3 |
| ”comprehensive” | 38 | 68%, 68% | 8 | 8 |
| ”value” | 19 | 68%, 84% | 5 | 2 |
- Ads appear more often with “best” and “cheap” than without them. Both differences passed our statistical checks. This does not prove the words caused an ad to appear.
- “Rated”, “comprehensive” and “value” show no clear direction.
- In pairs comparing queries with and without “cheap” or “cheapest”, Budget Direct has an ad only on the version with the word in 23 pairs, and only on the version without it in 4.
- Other words show the same pattern: “online” (an ad appears only with the word in 27 pairs, and only without it in 8), “commercial” (13 and 0), and “Australian” (12 and 2).
- The advertiser shown changes about as often with one word changed as with nothing changed.
The second comparison has only 281 pairs, and several words have fewer than 20. These are early findings from a small sample.
5. 67% of ads are not for insurance: who advertises, sector by sector
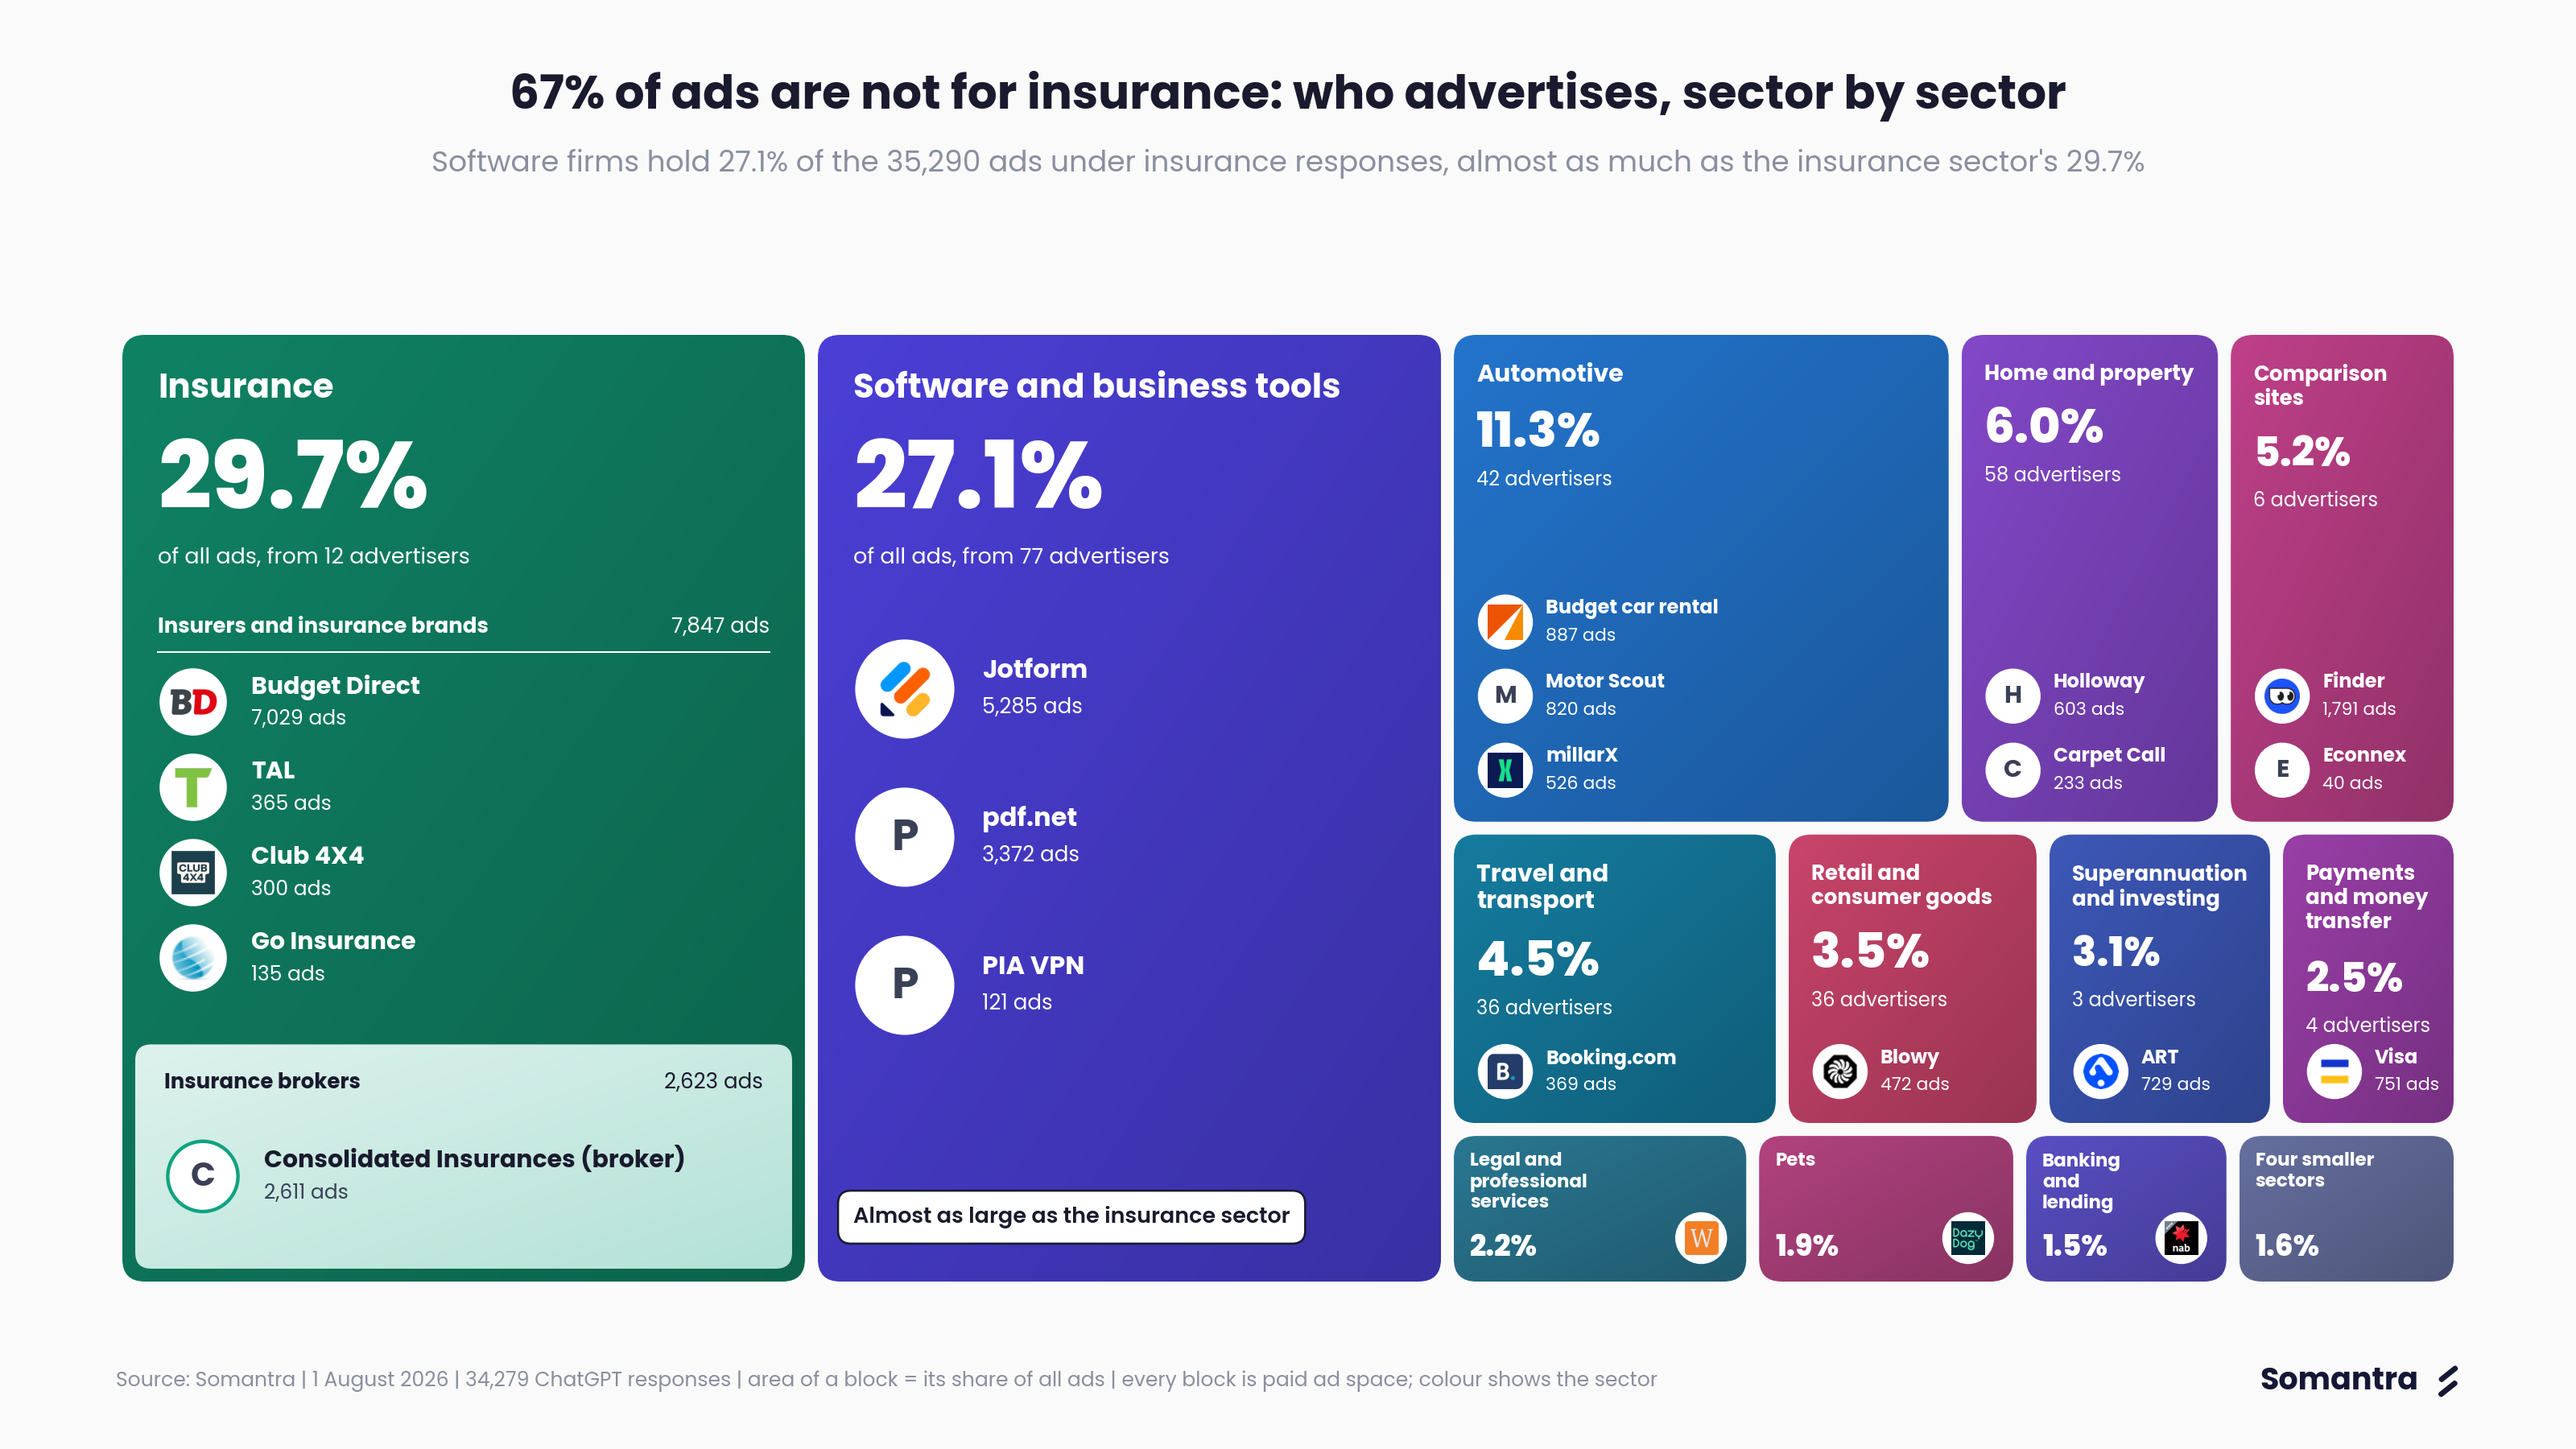
Only 33% of the ads under insurance queries sell insurance. We sorted all 371 advertisers by the business they are in.
| Sector | Advertisers | Ads | Share of ads | Largest advertiser (share of the sector’s ads) | Ad is in the query’s product or field | Off-topic |
|---|---|---|---|---|---|---|
| Insurance | 12 | 10,470 | 29.7% | Budget Direct (67.1%) | 41.6% | 6.8% |
| Software and business tools | 77 | 9,575 | 27.1% | Jotform (55.2%) | 0.0% | 71.7% |
| Automotive | 42 | 3,980 | 11.3% | Budget car rental (22.3%) | 90.2% | 4.0% |
| Home and property | 58 | 2,111 | 6.0% | Holloway Removals & Storage (28.6%) | 72.0% | 23.4% |
| Comparison sites | 6 | 1,848 | 5.2% | Finder (96.9%) | 0.5% | 83.5% |
| Travel and transport | 36 | 1,583 | 4.5% | Booking.com (23.3%) | 93.0% | 5.5% |
| Retail and consumer goods | 36 | 1,233 | 3.5% | Blowy (38.3%) | 0.0% | 65.5% |
| Superannuation and investing | 3 | 1,104 | 3.1% | Australian Retirement Trust (66.0%) | 83.1% | 16.9% |
| Payments and money transfer | 4 | 868 | 2.5% | Visa (86.5%) | 2.9% | 8.1% |
| Legal and professional services | 15 | 759 | 2.2% | Withstand Lawyers (48.1%) | 29.4% | 26.6% |
| Pets | 12 | 664 | 1.9% | Dazy Dog (47.9%) | 96.4% | 3.0% |
| Banking and lending | 9 | 530 | 1.5% | National Australia Bank (31.7%) | 32.5% | 55.7% |
| Business services | 36 | 302 | 0.9% | Cleanworks (35.8%) | 0.0% | 95.0% |
| Health and care | 10 | 211 | 0.6% | CareAbout (81.0%) | 0.0% | 96.2% |
| Education and training | 8 | 40 | 0.1% | Entry Education (37.5%) | 0.0% | 70.0% |
| Other | 7 | 12 | 0.0% | Pacific Seeds (25.0%) | 0.0% | 100.0% |
| All | 371 | 35,290 | 100% | Budget Direct (19.9%) | 36.6% | 33.9% |
Read this as: two sectors dominate the ad shelf. Insurance and software together hold 57% of all impressions, while the other 14 sectors share the rest.
“Sector” describes the advertiser’s business. It does not describe what each ad sells. Comparison sites are counted separately from the insurance sector, but 59% of their ads sell insurance. That helps explain why 33% of all ads sell insurance while 30% come from the insurance sector.
The last two columns do not add to 100%. Ads can also mention the query’s subject without offering a product or service in that field, or sell insurance without mentioning a product. “Off-topic” means an ad offers a different insurance product or has no identified link to the query’s subject. These are classifications from our rules, not a measure of how useful a reader found the ad.
Sector by sector: full detail for all 14 sectors (expand)
- Insurance (29.7% of ads). Two buyers hold 92% of it: Budget Direct (7,029 ads) and the broker Consolidated Insurances (2,611). Then TAL (365), Club 4X4 (300) and Go Insurance (135). The remaining seven advertisers have 30 ads between them, including five overseas insurance businesses. The sector’s ads appear most often under home (27%) and car (24%) queries, and most often under discount and “best” queries. 41.6% of the sector’s ads are for the product asked about. Example: the query “benefits of bundling home and contents insurance in Australia” carried Budget Direct’s “Comparing Car Insurance. Online Quote in Minutes. Get Insured Today”.
- Software and business tools (27.1%). Almost as large as insurance, and almost all two firms: the form builder Jotform (5,285) and the PDF tool pdf.net (3,372). Then three VPN services (219 together) and about 70 names with a handful of ads each. Their ads sit under pet queries (28%) and claims queries. Our rules classify none as offering a product in the query’s field, though 28.3% mention its subject in the headline, such as “Free Pet Health Record PDF”. Example: “How to renew pet insurance with military discount online?” carried “Free Document Sign & Fill Online”.
- Automotive (11.3%). Many mid-sized buyers: Budget car rental (887), the car buying service Motor Scout (820), millarX, which offers car leases paid through salary arrangements (526), then trackers, parts, dealers and towing. 64% of these ads are under car queries and 90.2% are in the query’s field. Example: “how to get car damage insurance for rental cars in Australia” carried “Remove car rental confusion. Find the perfect car rental for your needs”.
- Home and property (6.0%). The most advertisers after software (58), and the most local ones: 22 of its small advertisers mention a city or state. Holloway Removals & Storage (603), Carpet Call (233), a buyers agency (179), then removalists, security firms, flooring, solar and pools. 61% are under home queries. Example ad: “Need Storage In Sydney? Storage without the hassle.”
- Comparison sites (5.2%). Finder is 96.9% of it (1,791 ads). Its ads sit under life (32%) and travel (29%) queries and mostly offer something else: “Compare Health Cover. Is private health insurance right for you?”
- Travel and transport (4.5%). Booking.com (369), a flight agency (246), a booking app (221), then airlines and travel agents. 73% are under travel queries, most often cancellation and refund queries. 93.0% are in the query’s field.
- Retail and consumer goods (3.5%). Blowy, which sells one handheld workshop blower (472), the department store Harris Scarfe (163), the power-station brand EcoFlow (150), then large retailers with a few ads each. Spread over every type of insurance. Example: “what steps are required to claim flood damage on a car” carried “Top Rated Aussie Blower”.
- Superannuation and investing (3.1%). Two buyers: Australian Retirement Trust (729) and Vanguard (374). 83% are under life insurance queries. Ad: “Which super fund is right? Compare super funds.”
- Payments and money transfer (2.5%). Visa (751), OFX (68), Ezidebit (48). 76% are under travel queries. Not insurance, but 89.1% of the ads talk about travel: “Seamless Travel Security. Experience peace of mind with global payment protection.”
- Legal and professional services (2.2%). The claims firm Withstand Lawyers (365) and the quantity surveyors Duo Tax (233), then business and family lawyers. Most often under claims queries. Ad: “CTP Claim NSW. No Win No Fee.”
- Pets (1.9%). Dazy Dog, dog beds (318), Petstock (176), a dog stroller brand (66). 94% are under pet queries and 96.4% are in the query’s field, the closest fit of any sector.
- Banking and lending (1.5%). Four banks (NAB 168, Bankwest 107, ANZ 87, Westpac 51), a cash lender (89) and others. Under life and pet queries. 55.7% off-topic, such as a savings rate ad under a life insurance query.
- Business services, health and care, education, other (1.6% together, 61 advertisers). A commercial cleaner (108), a data recovery firm (56), an aged care placement service (171, more than half its ads under pet queries), 15 marketing agencies with 25 ads between them, eight colleges. 70% to 100% off-topic.
We classified 179 advertisers by name or known brand, 166 from their ad text, and 26 by reading their home pages. We have high confidence in the classifications of 205 advertisers, representing 88.7% of ads. Another 165 classifications, representing 11.3%, are likely; one advertiser with one ad remains uncertain.
6. What the ads say, and where they send you
The 35,290 recorded ads use 1,617 different versions of ad text. Each version is a distinct combination of headline and supporting text.
The message
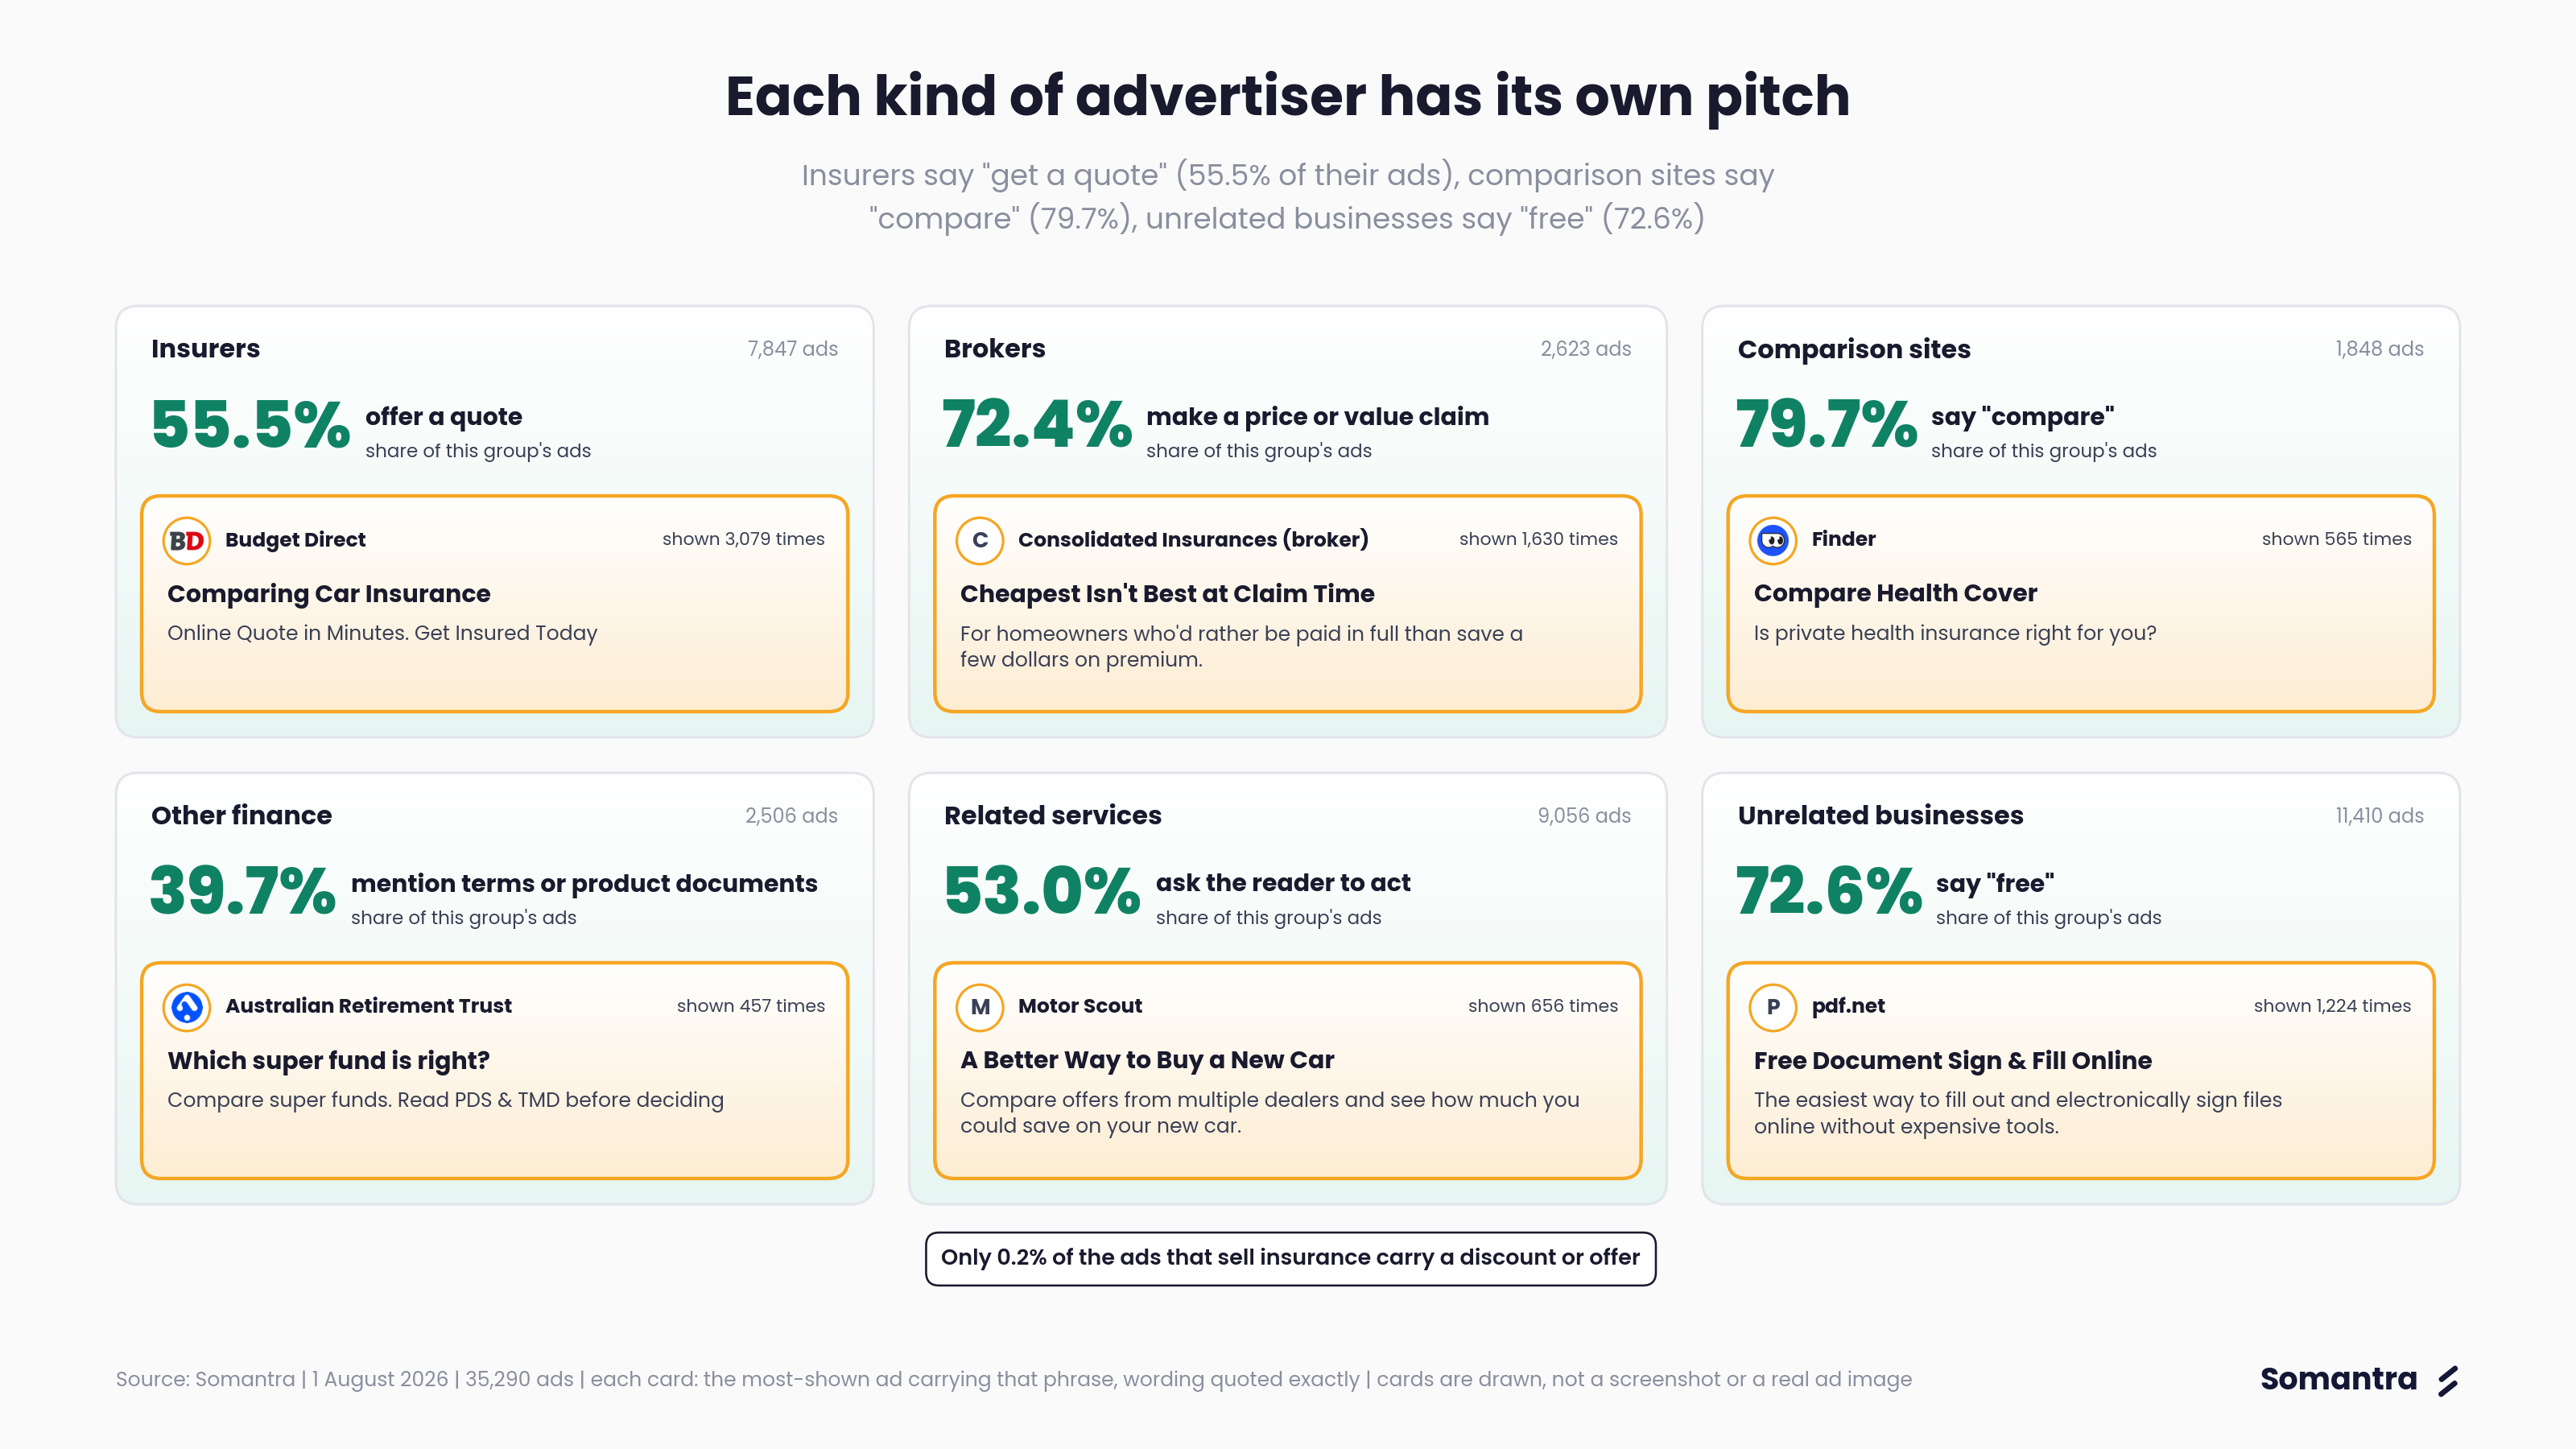
Here we group advertisers by business type. “Related services” includes businesses such as car sellers and removalists. “Unrelated businesses” is an advertiser category, not a judgement about every ad that business shows. The numbers in the column headings are ad counts.
| Share of ads that | Insurers (7,847) | Brokers (2,623) | Comparison sites (1,848) | Other finance (2,506) | Related services (9,056) | Unrelated businesses (11,410) |
|---|---|---|---|---|---|---|
| Ask the reader to act | 84.8% | 0.5% | 94.5% | 42.7% | 53.0% | 64.6% |
| Offer a quote | 55.5% | 0.5% | 0.2% | 0.0% | 13.5% | 4.1% |
| Say “compare” | 47.9% | 0.0% | 79.7% | 35.6% | 18.9% | 1.6% |
| Make a price or value claim | 18.9% | 72.4% | 25.9% | 9.7% | 24.5% | 3.0% |
| Carry a discount or offer | 0.1% | 0.0% | 17.0% | 4.2% | 11.9% | 0.8% |
| Say “free” | 0.0% | 0.0% | 1.1% | 1.6% | 13.2% | 72.6% |
| Mention an award or rating | 7.8% | 0.0% | 1.1% | 0.3% | 6.2% | 5.2% |
| Mention terms or product documents | 0.0% | 0.0% | 0.0% | 39.7% | 0.0% | 0.1% |
- Each kind of advertiser has its own pitch. Insurers say “get a quote”. Comparison sites say “compare”. Brokers argue about value. Businesses from outside insurance say “free”.
- Insurance ads almost never carry a discount: 0.2% of the ads that sell insurance.
- Few broker ads explicitly ask the reader to act (0.5%), based on the phrases our rules detect. Most make a statement about cover or value.
- Terms and product-document notices appear mainly in other finance ads (39.7%), such as “Read PDS & TMD before deciding” or “T&Cs apply”. Our rules found none in insurer ad text. PDS means Product Disclosure Statement; TMD means Target Market Determination, a document describing whom a product is designed for. This check covers ad text, not the linked pages.
How the main advertisers place ads
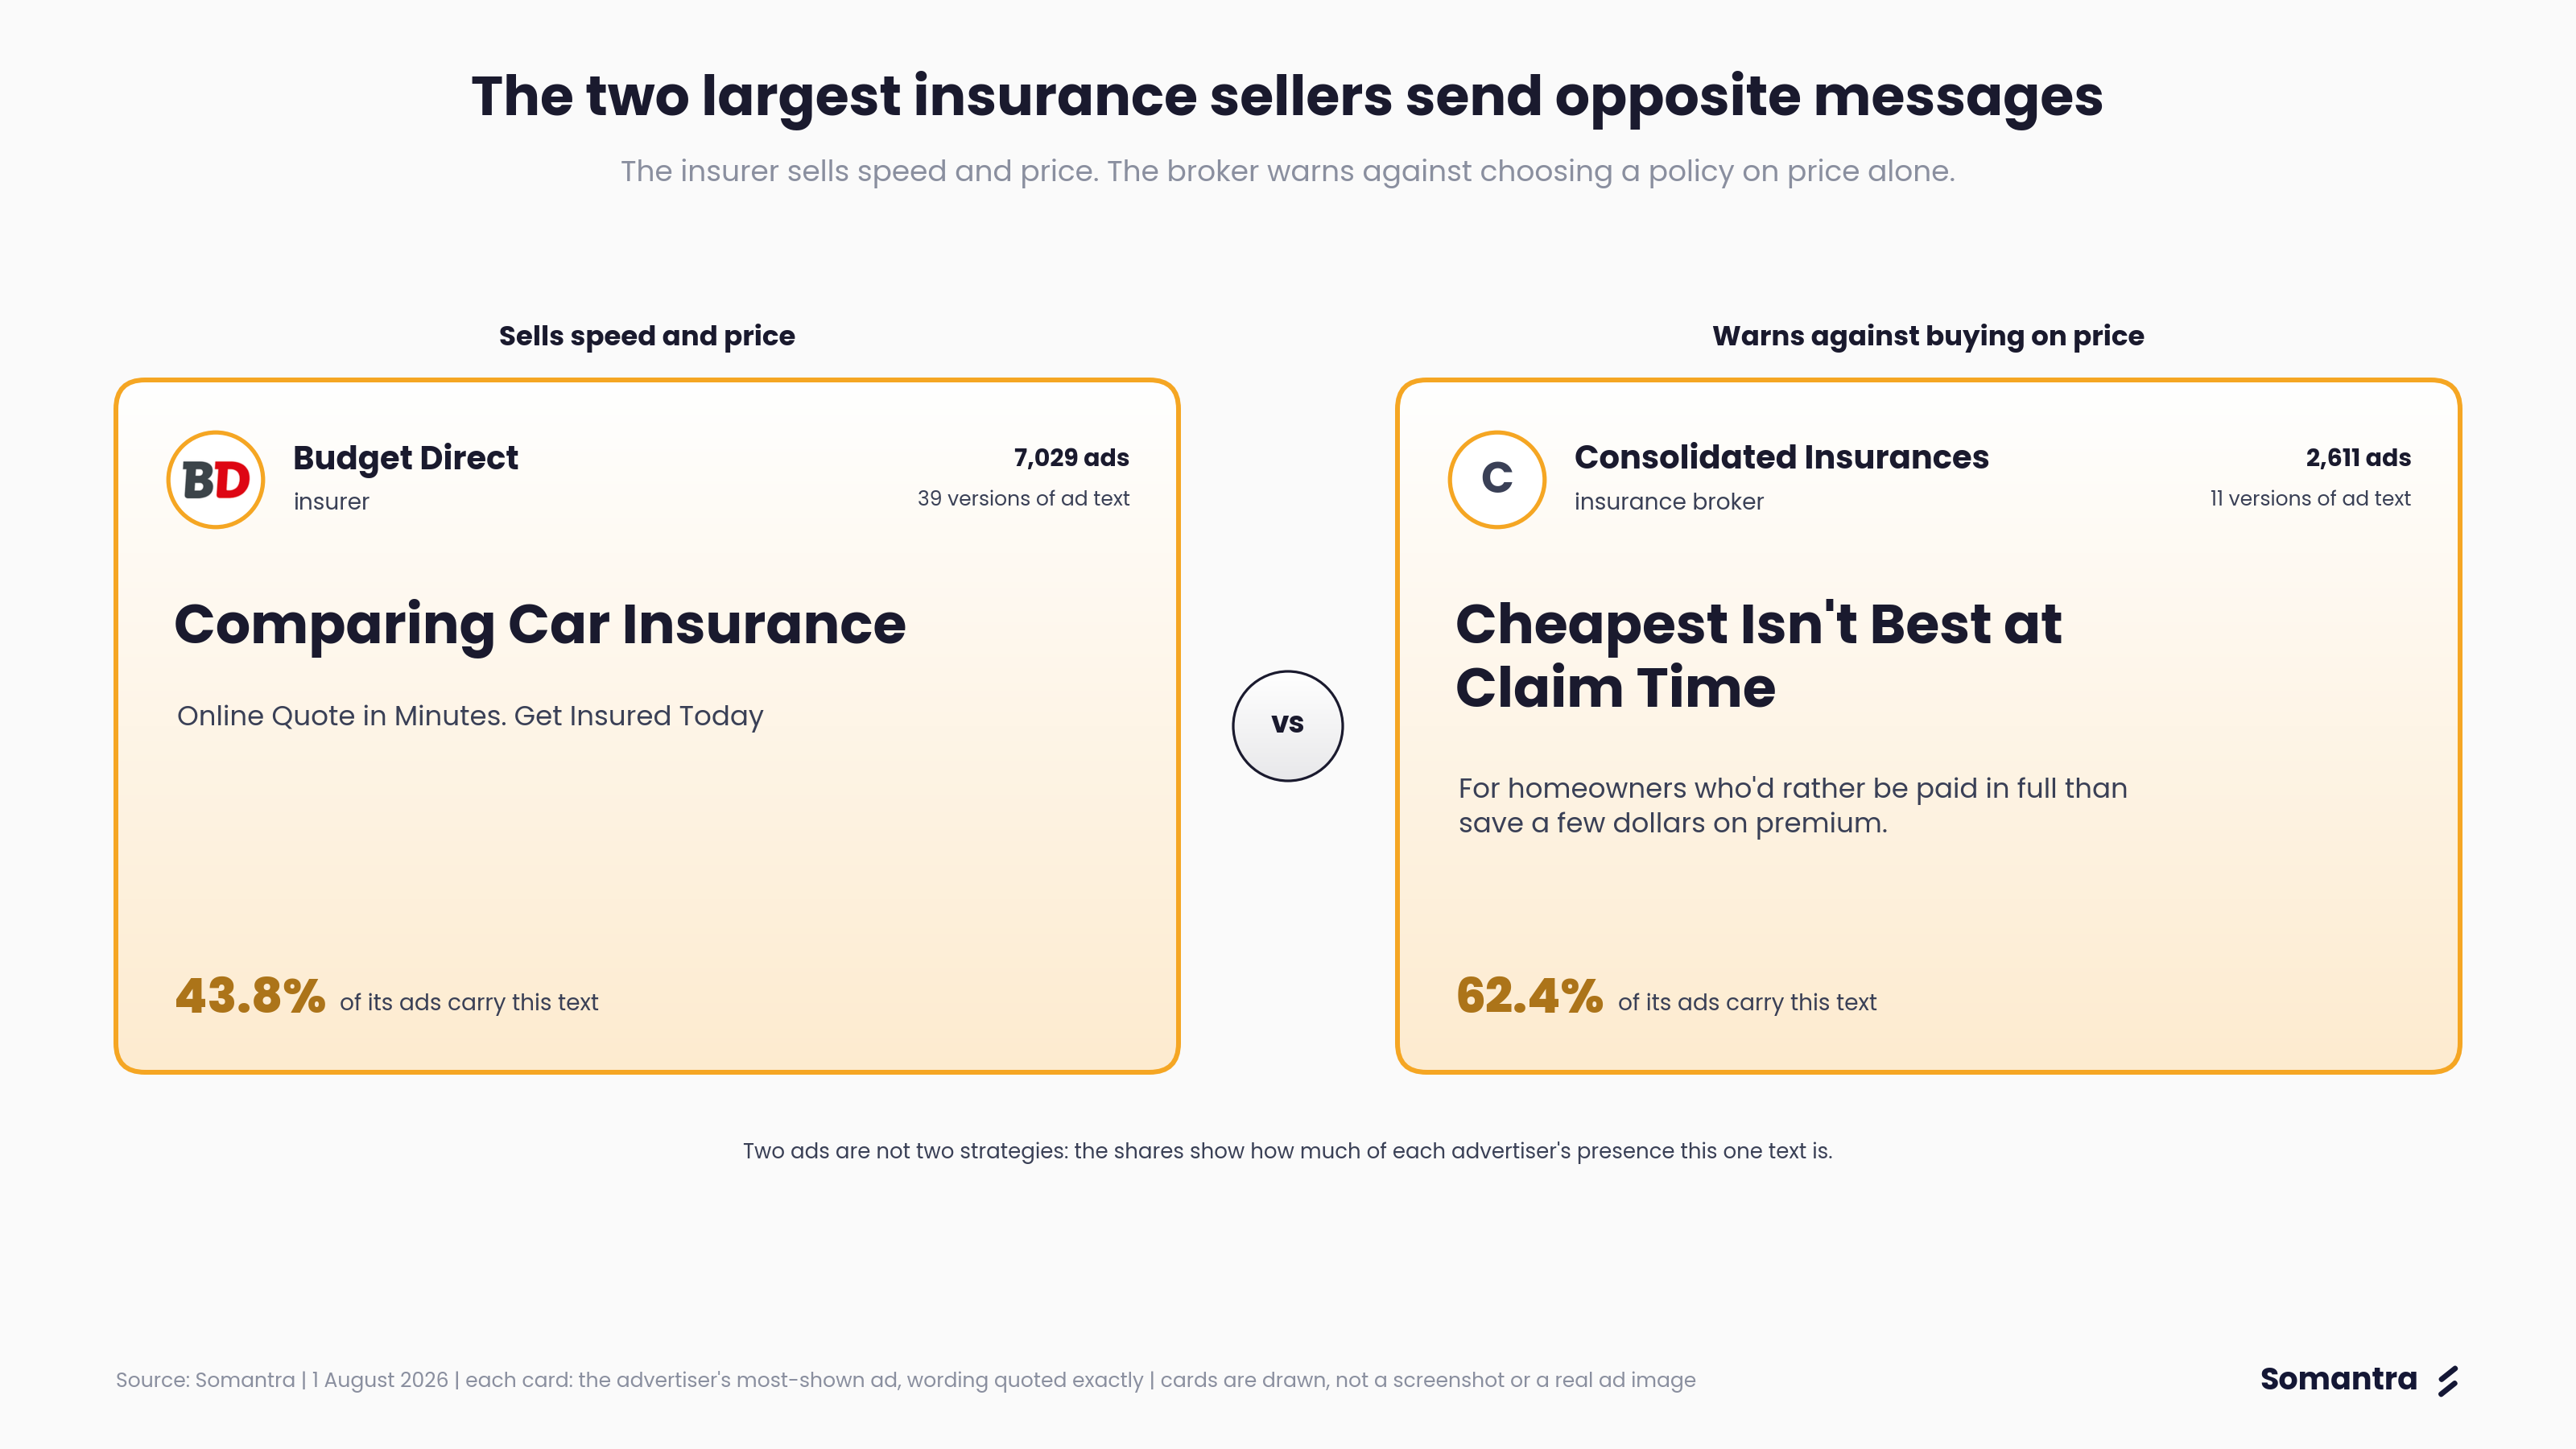
| Advertiser | Ads | Ad versions | Linked pages | Most common ad text (share of its ads) | Approach |
|---|---|---|---|---|---|
| Budget Direct (insurer) | 7,029 | 39 | 5 | ”Comparing Car Insurance. Online Quote in Minutes. Get Insured Today” (43.8%) | Quote and ease. Headlines such as “Confused By Insurance?” and “Insurance Too Expensive?” |
| Consolidated Insurances (broker) | 2,611 | 11 | 4 | ”Cheapest Isn’t Best at Claim Time” (62.4%) | Argues against buying on price. Also “We Don’t Do Cheap Home Cover” |
| Finder (comparison site) | 1,791 | 24 | 18 | ”Compare Health Cover. Is private health insurance right for you?” (31.5%) | One page per product: health cover, credit cards, super funds, mobile plans |
| TAL (life insurer) | 365 | 10 | 2 | ”Get an easy online quote. 3-time Finder awarded cover” (29.6%) | Awards in 70.1% of its ads |
| Club 4X4 (4WD insurance) | 300 | 1 | 1 | ”Club 4X4: Covers Your Mods” (100%) | One niche message, sent to the home page |
| Go Insurance (travel) | 135 | 2 | 1 | ”Award-Winning Travel Insurance” (94.8%) | Award and product features |
| Jotform (form builder) | 5,285 | 258 | 29 | ”Free Pet Health Record PDF” (19.1%) | A headline built for each topic: “Free Car Insurance Claim Form Templates”, “Free Property Condition Report Templates” |
| pdf.net (PDF tool) | 3,372 | 46 | 1 | ”Free Document Sign & Fill Online” (36.3%) | Many headlines, one home page |
| Visa (card network) | 751 | 27 | 8 | ”Seamless Travel Security” (47.1%) | Travel themes: “Travel with Visa. Enjoy 0% international fees on selected Visa Cards” |
| Australian Retirement Trust (super fund) | 729 | 10 | not readable | ”Which super fund is right? Compare super funds. Read PDS & TMD before deciding” (62.7%) | Every ad includes the product-document notice |
| Motor Scout (car buying) | 820 | 4 | 1 | ”A Better Way to Buy a New Car” (80.0%) | One offer, repeated |
| Booking.com (travel) | 369 | 90 | 70 | ”Australia. Search a wide range of ski resorts in Australia.” (21.4%) | Different ad text and pages for different destinations |
Read this as: each major advertiser runs a consistent playbook, from a single line repeated (Club 4X4, Motor Scout) to a fresh headline per topic (Jotform’s 258 versions).
- Most advertisers use one version of ad text. 194 of 371 have a single version, which may appear many times.
- A few use many versions. Four have more than 50: Jotform (258), Booking.com (90), NAB (55) and Anaconda (53).
- The two largest insurance sellers send opposite messages. The insurer sells speed and price. The broker warns against choosing a policy on price alone.
- Awards are used unevenly. TAL mentions one in 70.1% of its ads, Budget Direct in 3.2%.
- Budget Direct rarely mentions itself in the ad text (4.2% of its ads). Its name shows through the advertiser label.
Call to Actions
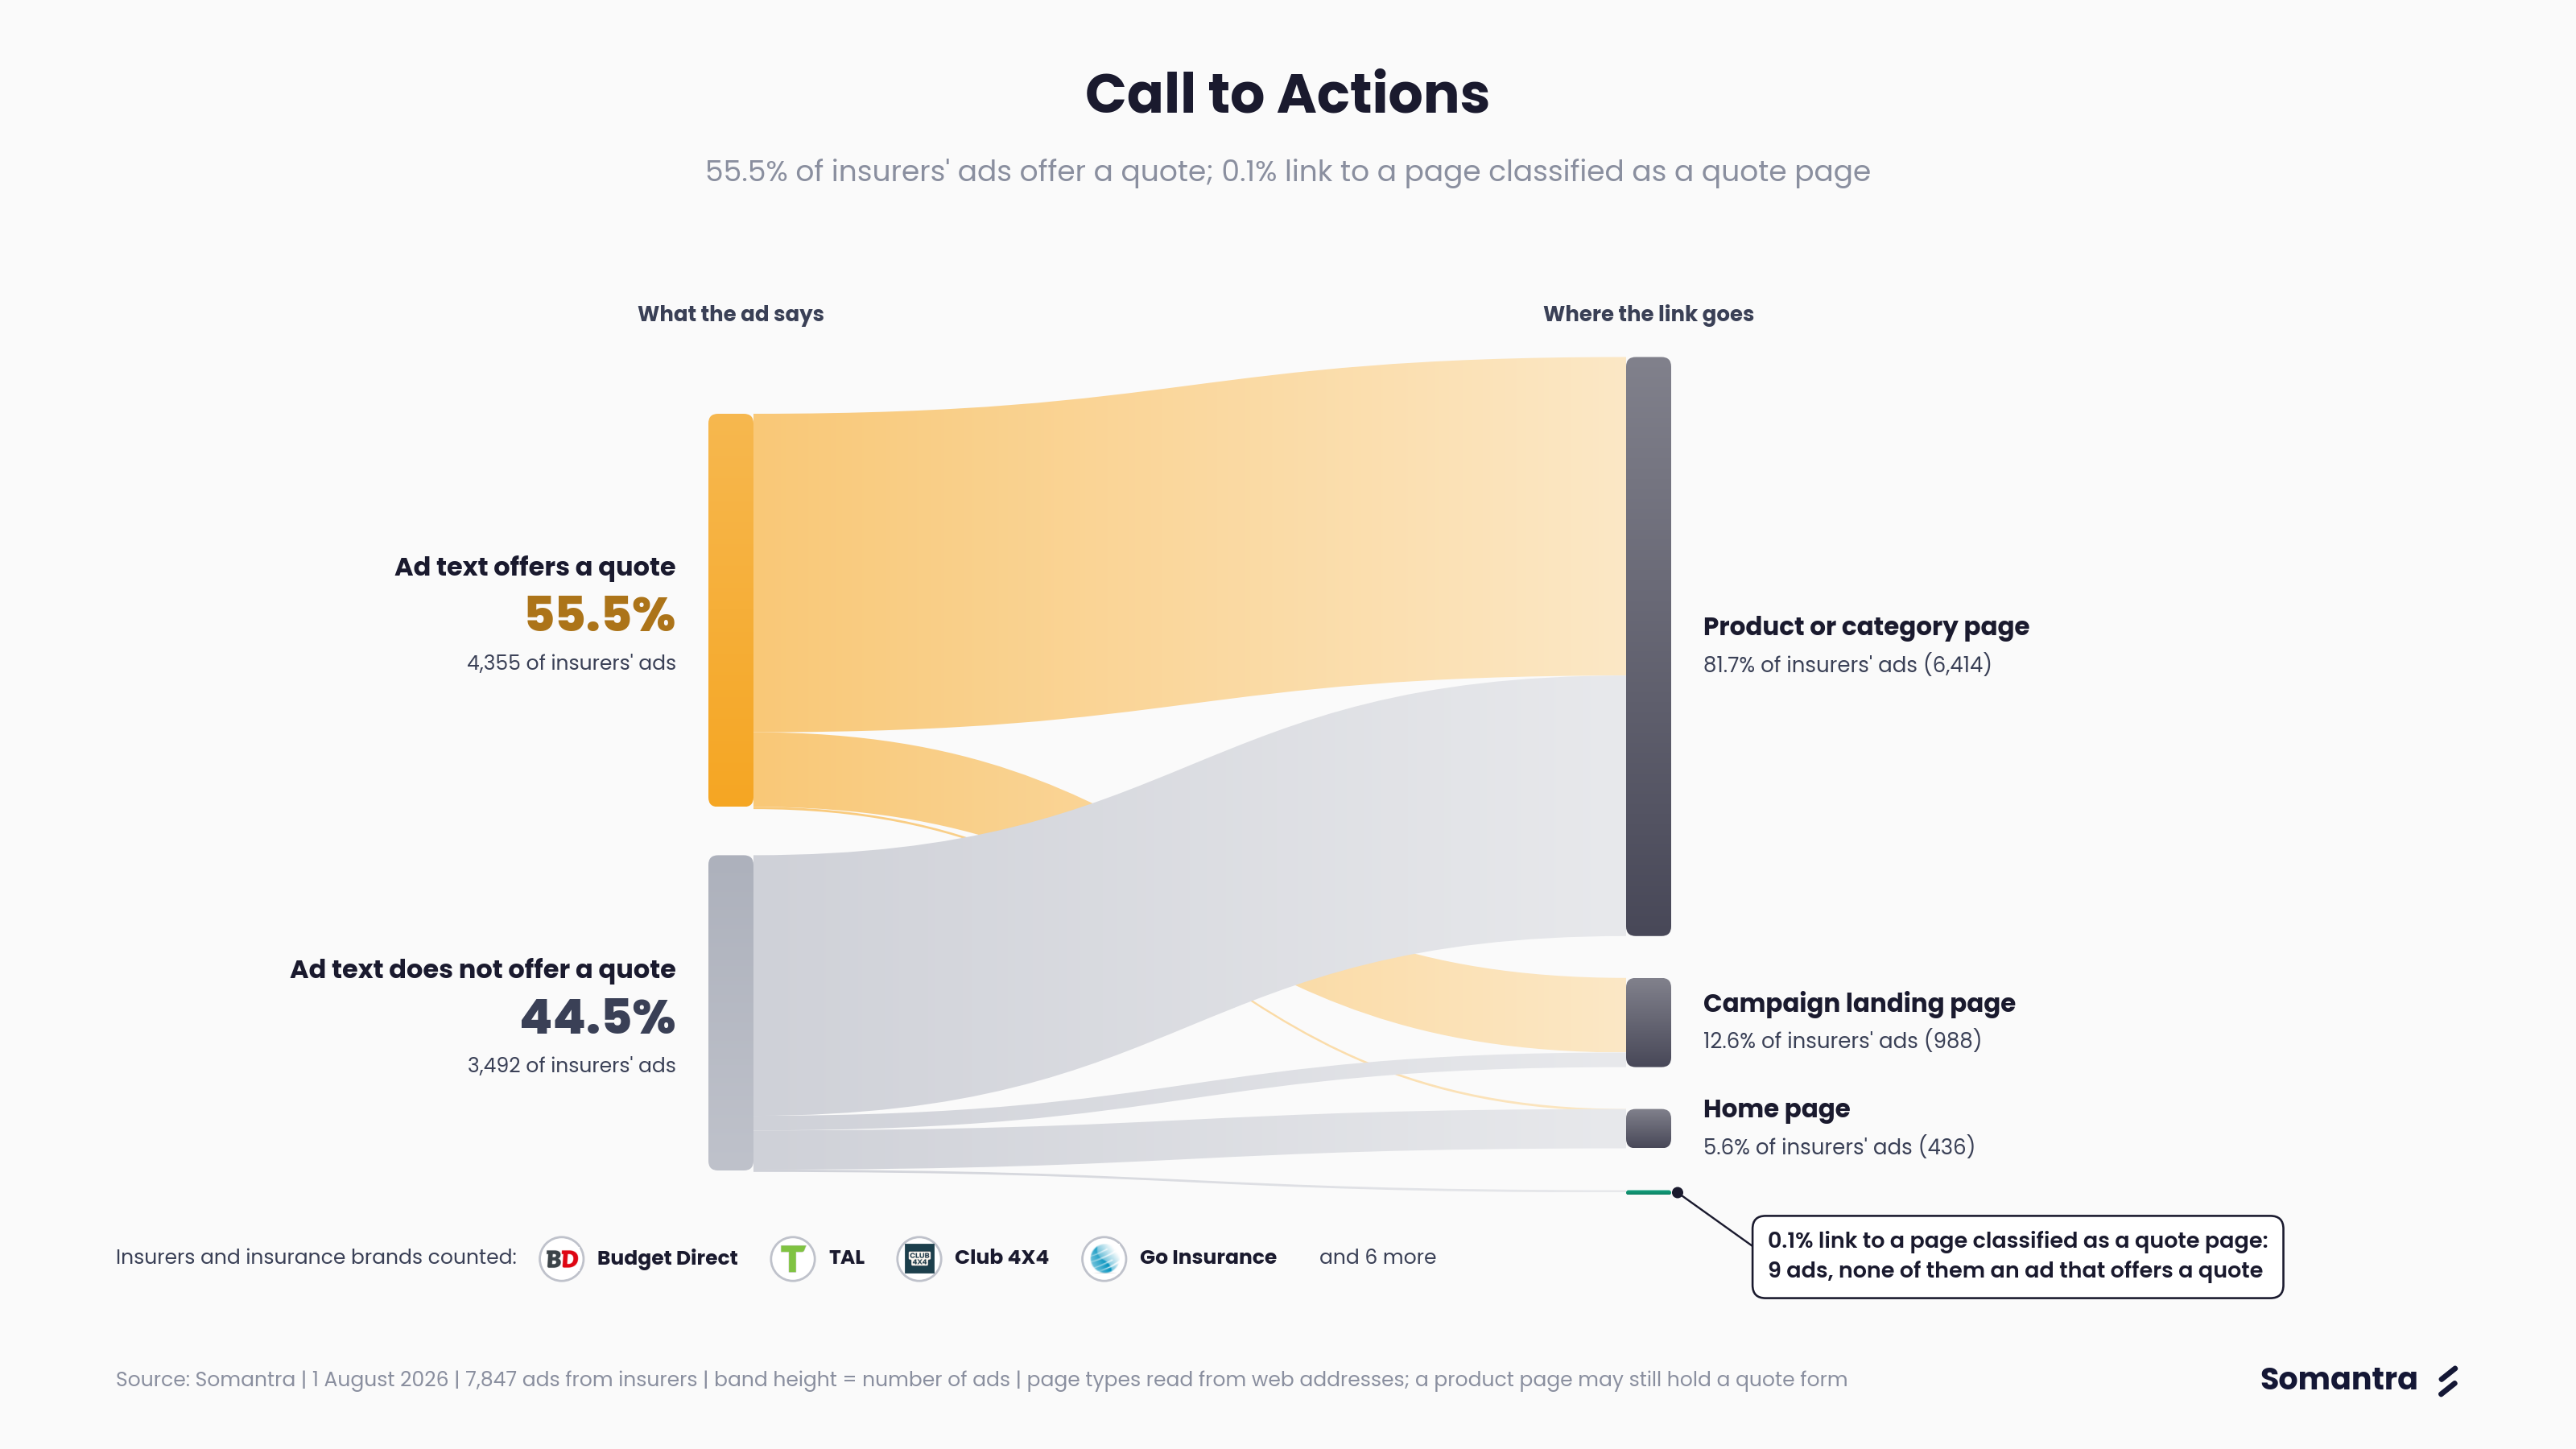
| Landing page | Insurers | Brokers | Comparison sites | Other finance | Related services | Unrelated | All ads |
|---|---|---|---|---|---|---|---|
| Product or category page | 81.7% | 72.2% | 63.9% | 46.9% | 40.2% | 56.4% | 58.7% |
| Home page | 5.6% | 0.0% | 0.0% | 0.2% | 28.7% | 35.2% | 20.0% |
| Campaign landing page | 12.6% | 27.4% | 0.3% | 15.0% | 8.2% | 4.6% | 9.5% |
| Hidden behind a tracking link | 0.0% | 0.0% | 0.0% | 31.8% | 13.3% | 0.2% | 5.7% |
| Quote, booking or sign-up page | 0.1% | 0.5% | 0.0% | 6.1% | 9.2% | 3.4% | 3.9% |
| Comparison or list page | 0.0% | 0.0% | 32.2% | 0.0% | 0.3% | 0.1% | 1.8% |
Page types are inferred from the web addresses. We did not open the links, so we have not checked the page contents or whether a quote form is available there.
- Quote offers usually link to addresses classified as product pages. 55.5% of insurers’ ads offer a quote; 0.1% have a link classified as a quote page. A product page may still contain a quote form or button.
- Insurer ads mostly link to product pages. 81.7% have links classified as product pages and 5.6% as home pages.
- Businesses outside insurance often link to their home page. 35.2% of unrelated advertisers’ ads and 28.7% of adjacent services’ land on the home page.
- Budget Direct pairs each message with its own page. Every ad sits in one campaign, tagged for motor insurance. Inside it, 55% of ads are tagged “compare” and all of those land on a policy options page. 25% are tagged “coverage-understanding”, 13% “cost-budgeting” and 5% “third-party”, each with its own page. All five pages are car insurance pages.
- Jotform matches the page to the topic too: 29 linked pages for 258 versions of ad text.
How the links are tracked
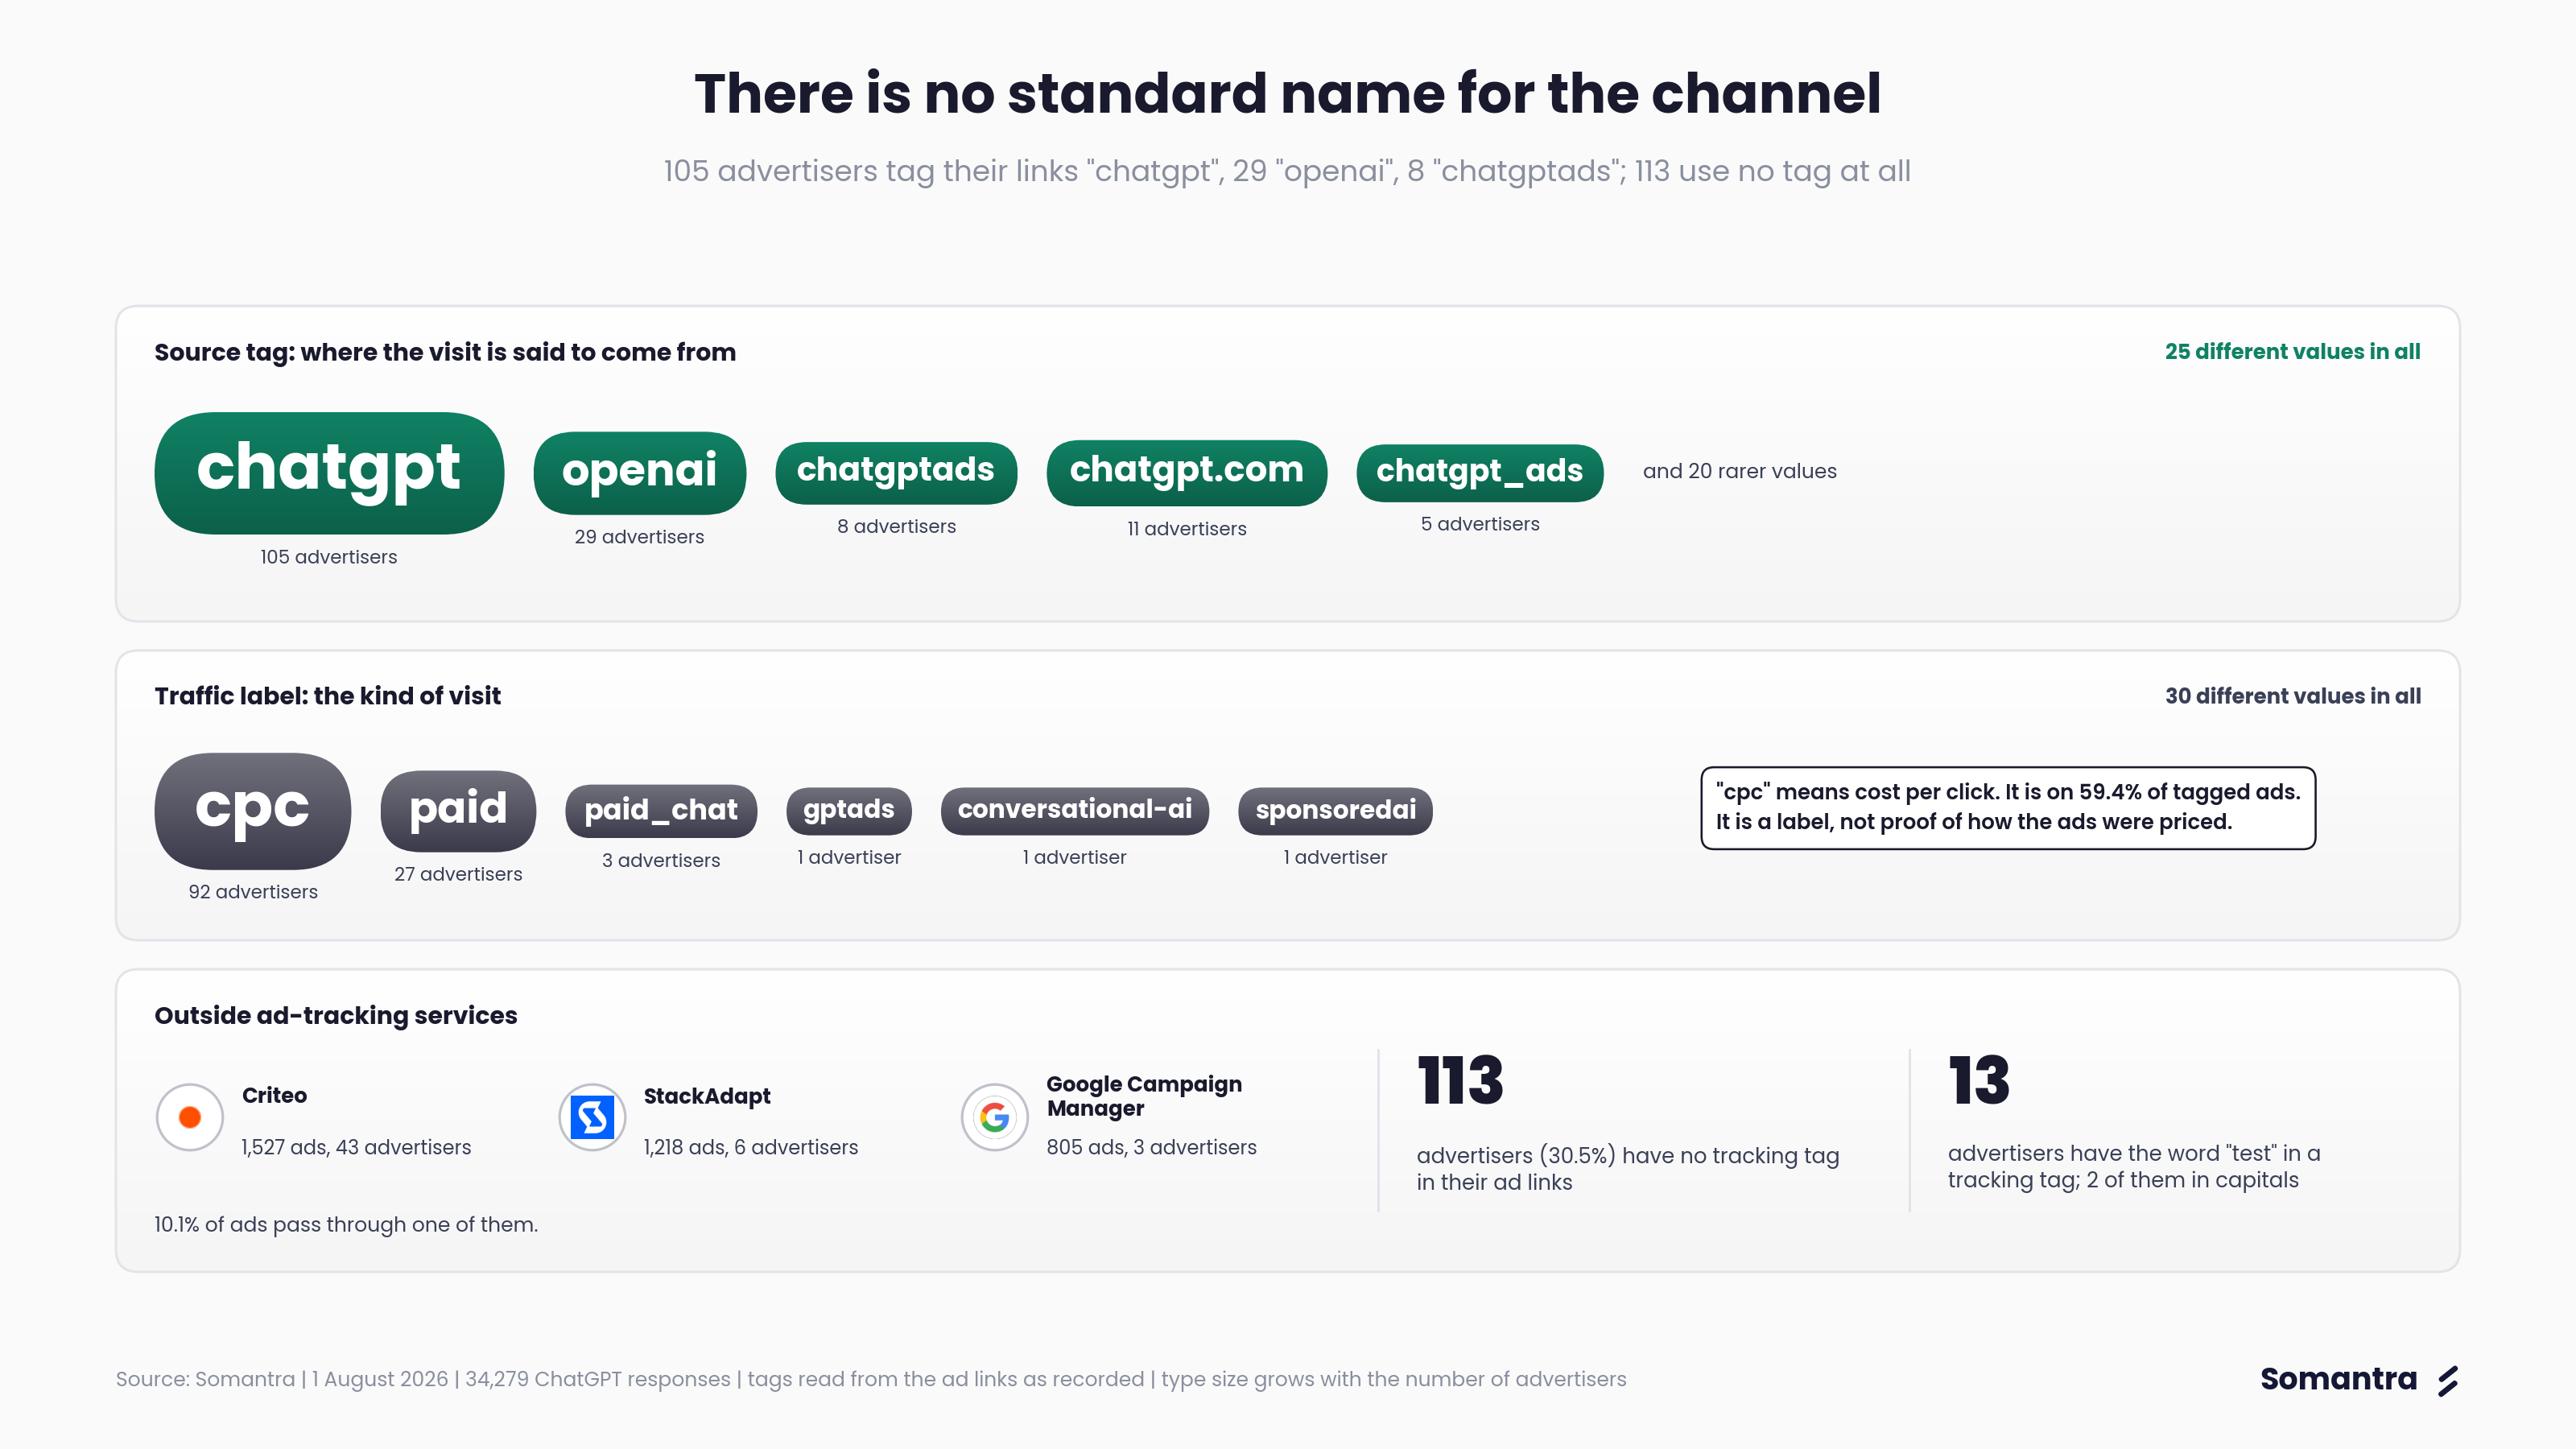
- 83.1% of ads have tracking tags in their links, and 73.4% mention ChatGPT or OpenAI. These tags can help advertisers identify visits from this channel; we cannot see how they use that information.
- There is no standard name for the channel. The source field, which labels where a visit came from, is set to
chatgpt(40.3% of tagged ads, 105 advertisers),openai(31.6%, 29 advertisers) orchatgptads(23.4%, 8 advertisers), with 22 rarer spellings. - The most common traffic label is
cpc, meaning cost per click. It appears in the medium field on 59.4% of tagged ads, from 92 advertisers. This is a tracking label, not evidence of how the ads were priced. Others invent their own:gptads,paid_chat,conversational-ai,sponsoredai. - Some campaign names refer to search. Finder’s campaign names include the word “Search”. One advertiser’s campaign is named for a launch month, and 13 advertisers have the word “test” in a tracking tag, 2 of them in capitals.
- 10.1% of ads pass through an outside ad-tracking service: Criteo (1,527 ads, 43 advertisers), StackAdapt (1,218 ads, 6 advertisers) and Google Campaign Manager (805 ads, 3 advertisers).
- 30.5% of advertisers (113) have no tracking tags detected in their ad links. We also found no search-style click identifiers in the captured links. This does not rule out other tracking methods.
We classified messages using written rules, so these percentages are estimates. Campaign and linked-page counts refer to the captured links, not every campaign or page an advertiser uses.
7. Only 1 of the 20 tracked insurers has ads selling insurance
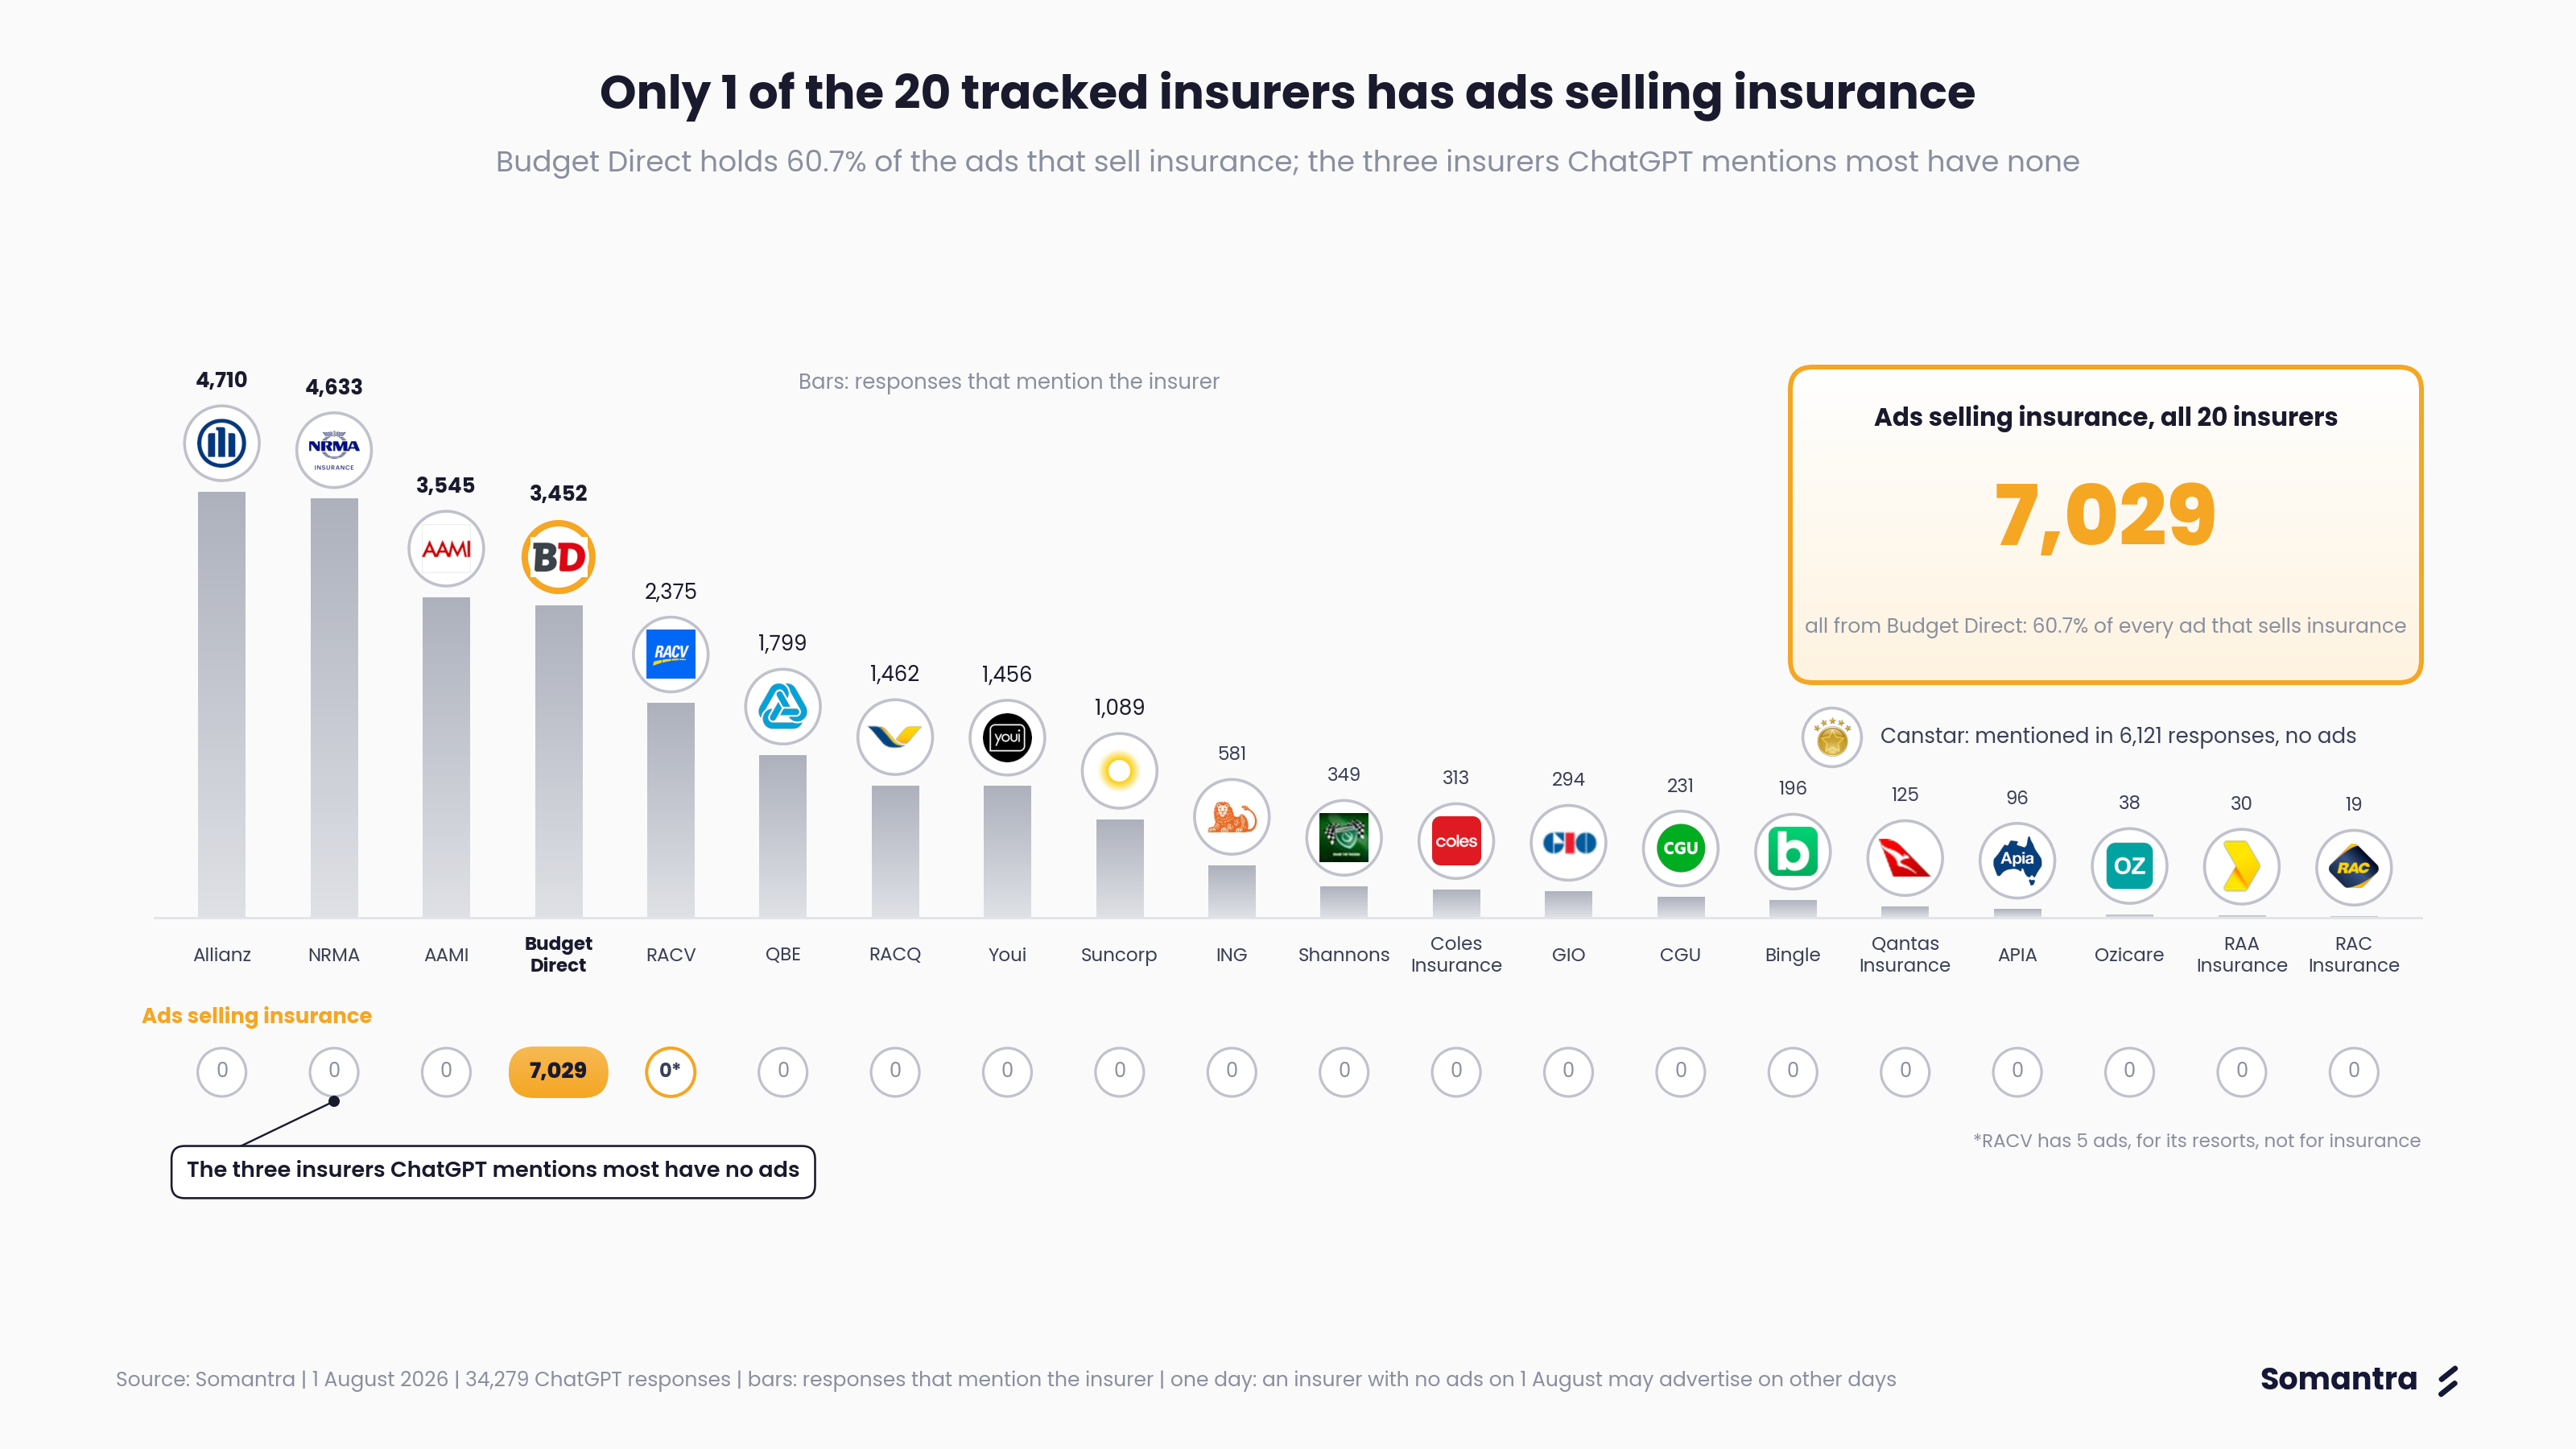
- Budget Direct holds 19.9% of all ads and 60.7% of the ads that sell insurance. Its ad is under 19.6% of responses.
- The other 19 have no ads selling insurance in this sample. That includes the three insurers ChatGPT mentions most. RACV has five ads, but they promote resorts.
- With one broker, Budget Direct accounts for 92% of the insurance sector’s ads.
| Responses that mention it | Insurance ads | |
|---|---|---|
| Allianz | 4,710 | 0 |
| NRMA | 4,633 | 0 |
| AAMI | 3,545 | 0 |
| Budget Direct | 3,452 | 7,029 |
| RACV | 2,375 | 0 |
| QBE | 1,799 | 0 |
Canstar, the name ChatGPT mentions and cites most in this insurance sample, also has no ads.
Brokers and comparison sites hold 32% of the ads that sell insurance. Most of that is one broker in home insurance and one comparison site in life and travel.
Two days only, 1 and 3 August 2026. An insurer with no ads on those days may advertise on others.
8. Being mentioned and being advertised rarely go together
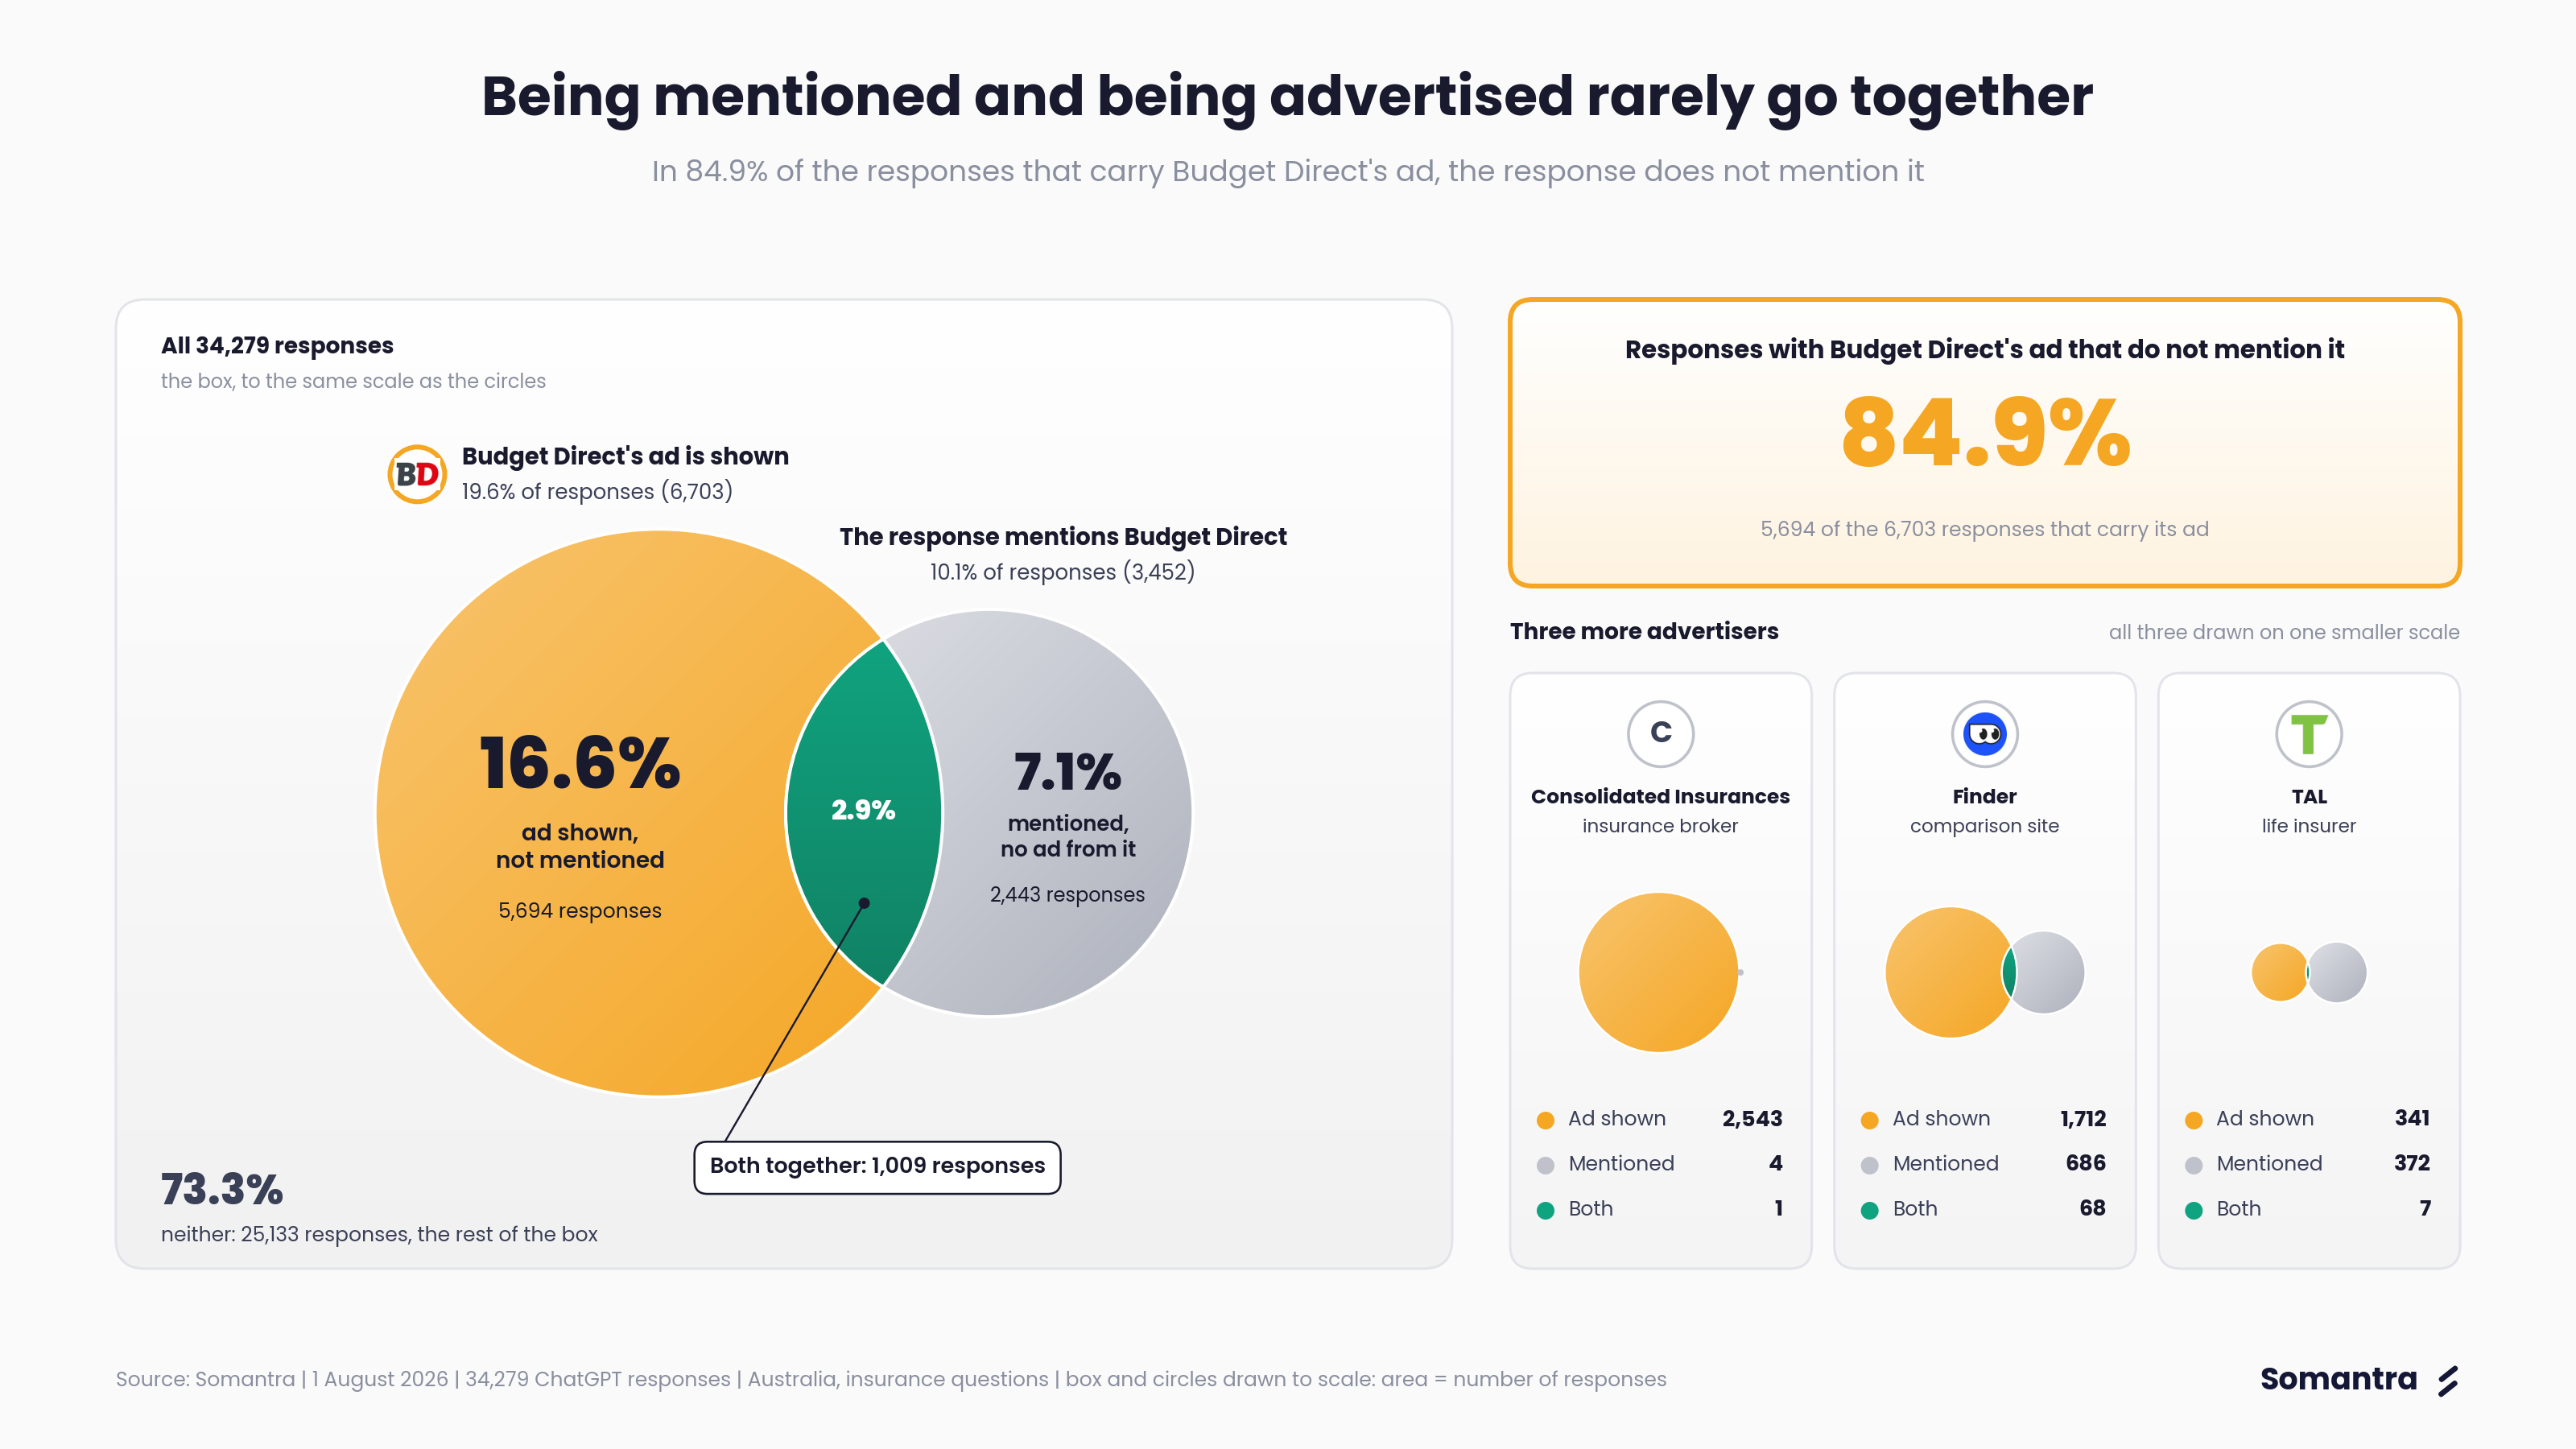
For Budget Direct, each response falls into one of four groups.
| Share of all responses | |
|---|---|
| Its ad is shown, and the response mentions it | 2.9% |
| Its ad is shown, and the response does not mention it | 16.6% |
| The response mentions it, but its own ad is absent | 7.1% |
| Neither | 73.3% |
- In 84.9% of the responses that carry its ad, Budget Direct is absent from the response text.
- Of the responses that do mention Budget Direct, 29.2% also carry its ad.
- For the other advertisers the split is starker. The largest broker has 2,543 responses with its ad and is mentioned in one of them.
The businesses mentioned in responses often differ from those advertising below them.
9. Few responses with insurance ads mention an advertiser first
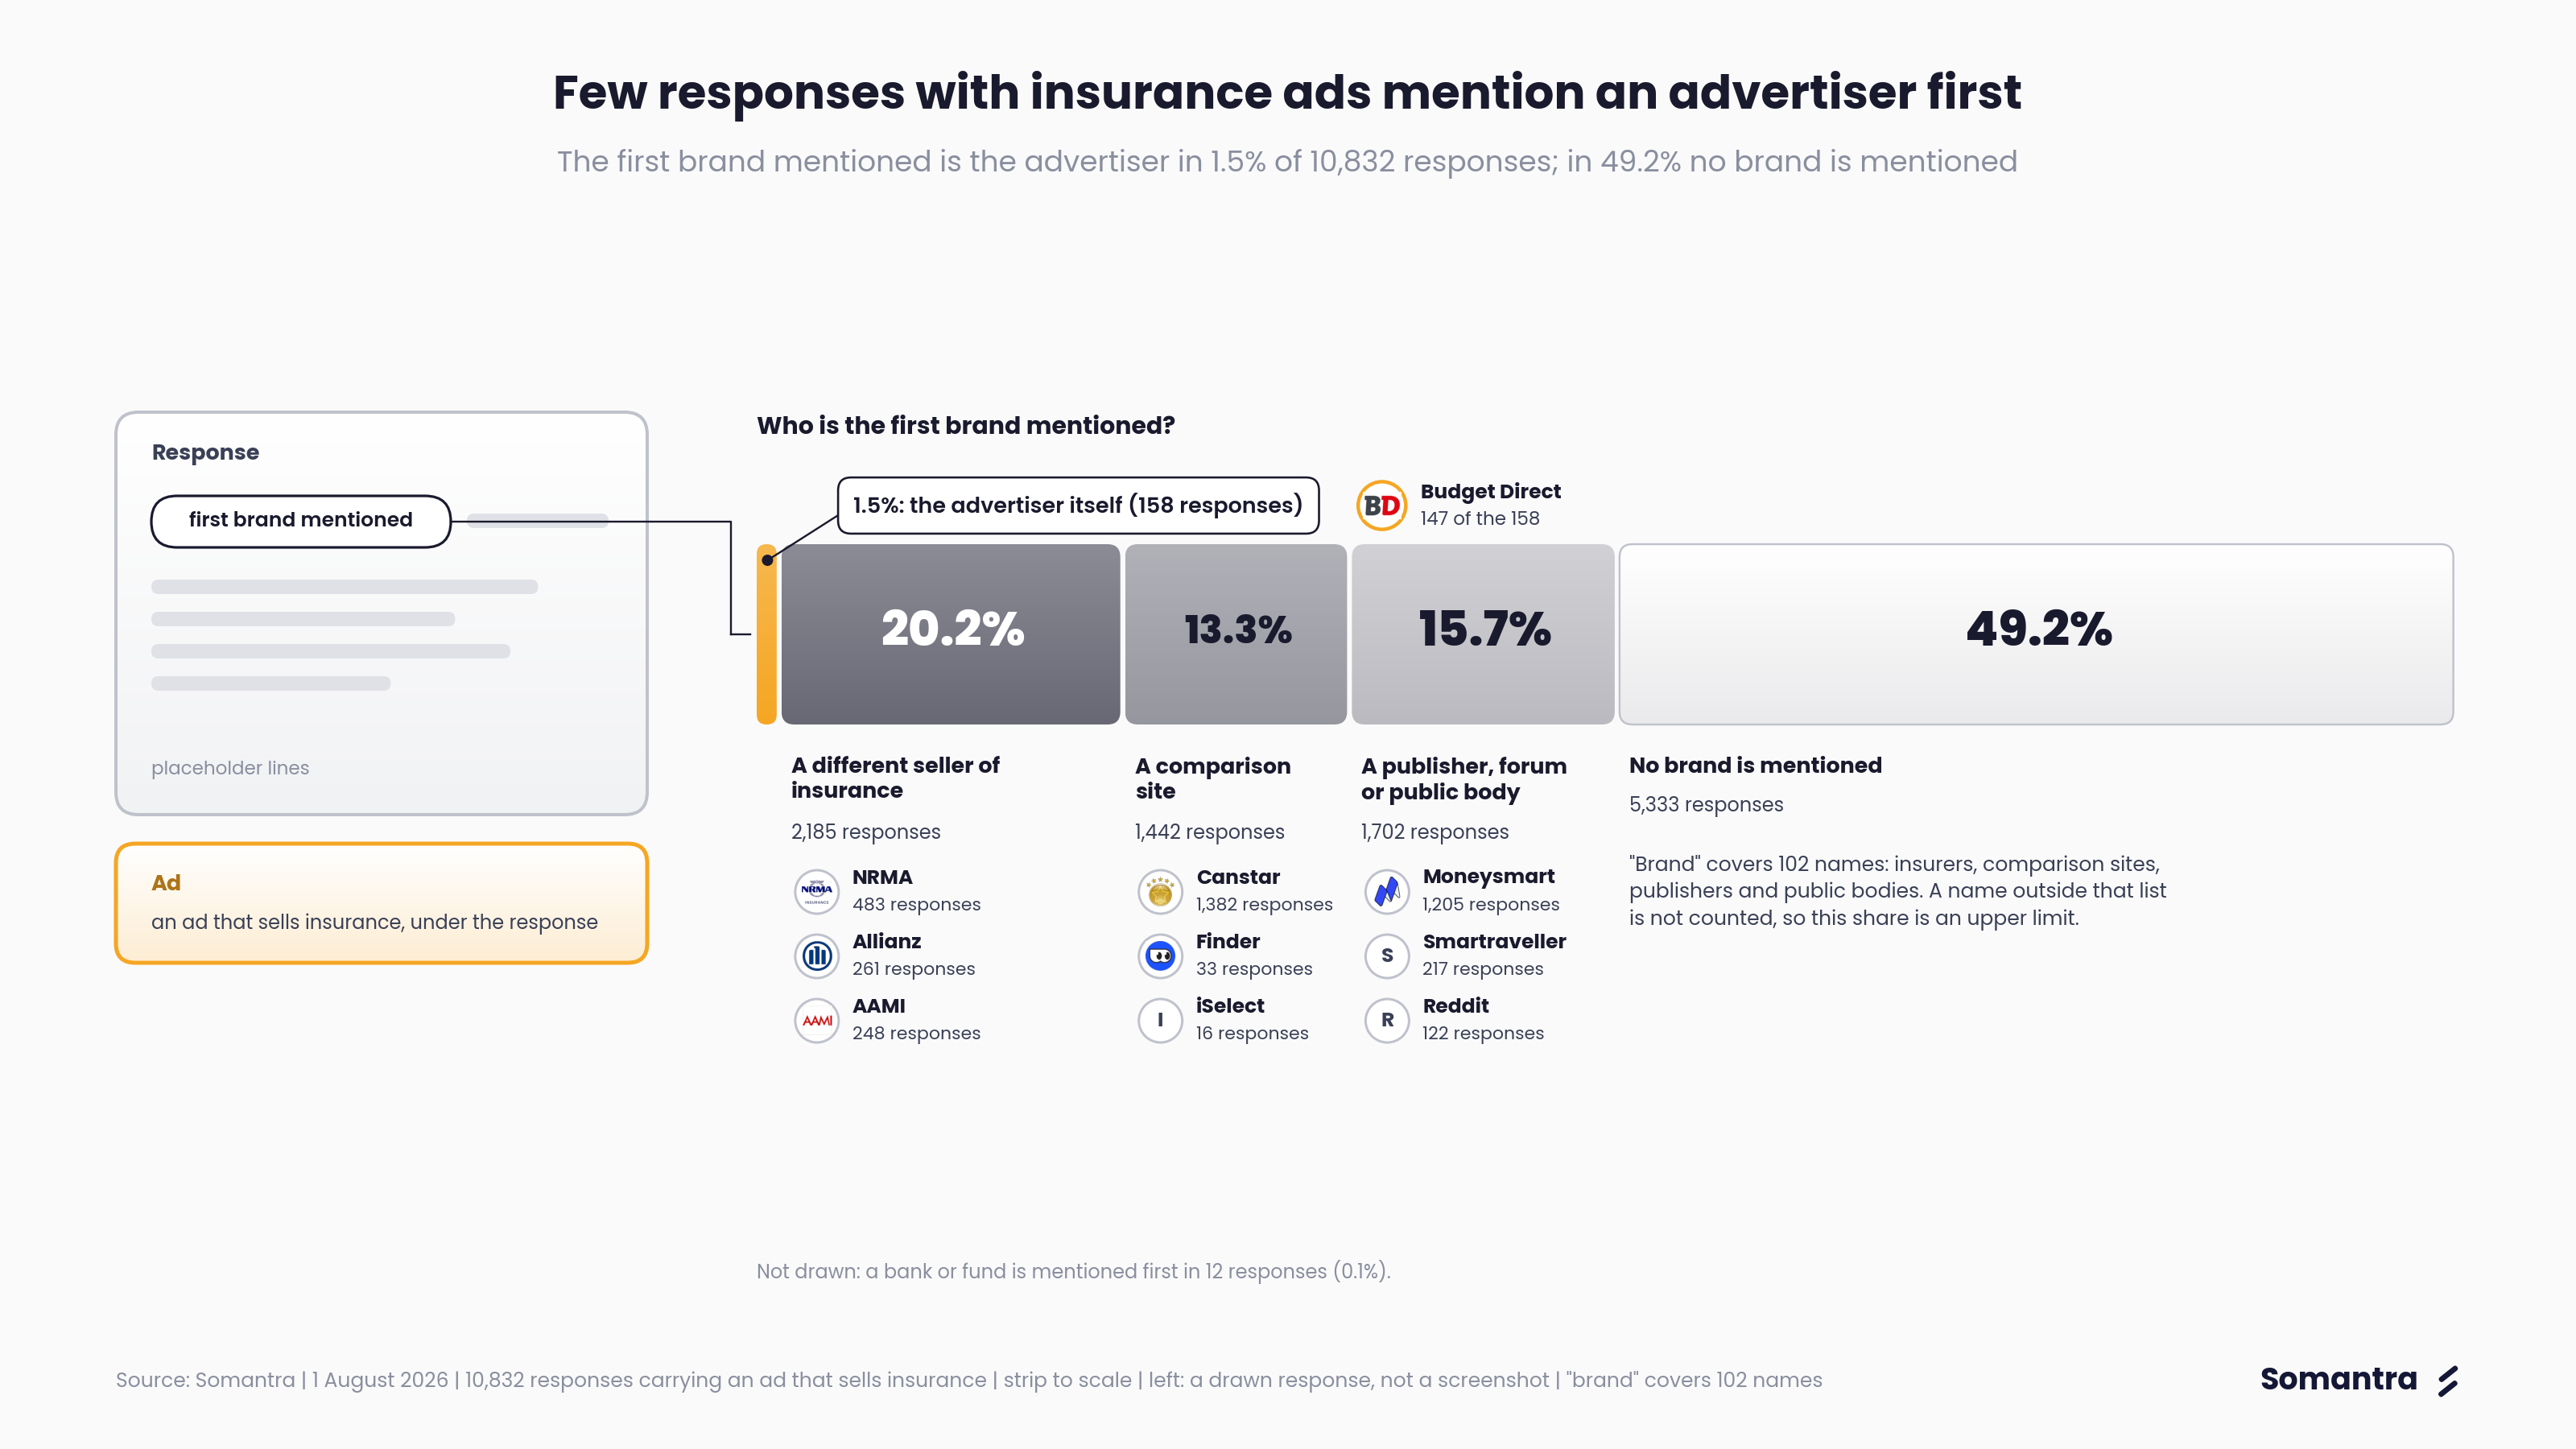
Of the 10,832 responses carrying an insurance ad, 1.5% mention one of those insurance advertisers first. The table shows which kind of name appears first, if any.
| The first brand mentioned is | Share |
|---|---|
| The advertiser itself | 1.5% |
| A different seller of insurance | 20.2% |
| A comparison site | 13.3% |
| A publisher, forum or public body | 15.7% |
| No brand is mentioned | 49.2% |
- Looking instead at responses that mention a brand: that first brand’s own ad appears below the response 1.1% of the time. Another seller’s insurance ad is there 34.2% of the time.
- The brands most often mentioned first above a Budget Direct ad are Canstar (852 responses), Moneysmart (769) and NRMA (367).
“Brand” covers 102 names: insurers, comparison sites, publishers and public bodies.
10. The response mentions an insurer. The ad often comes from someone else.
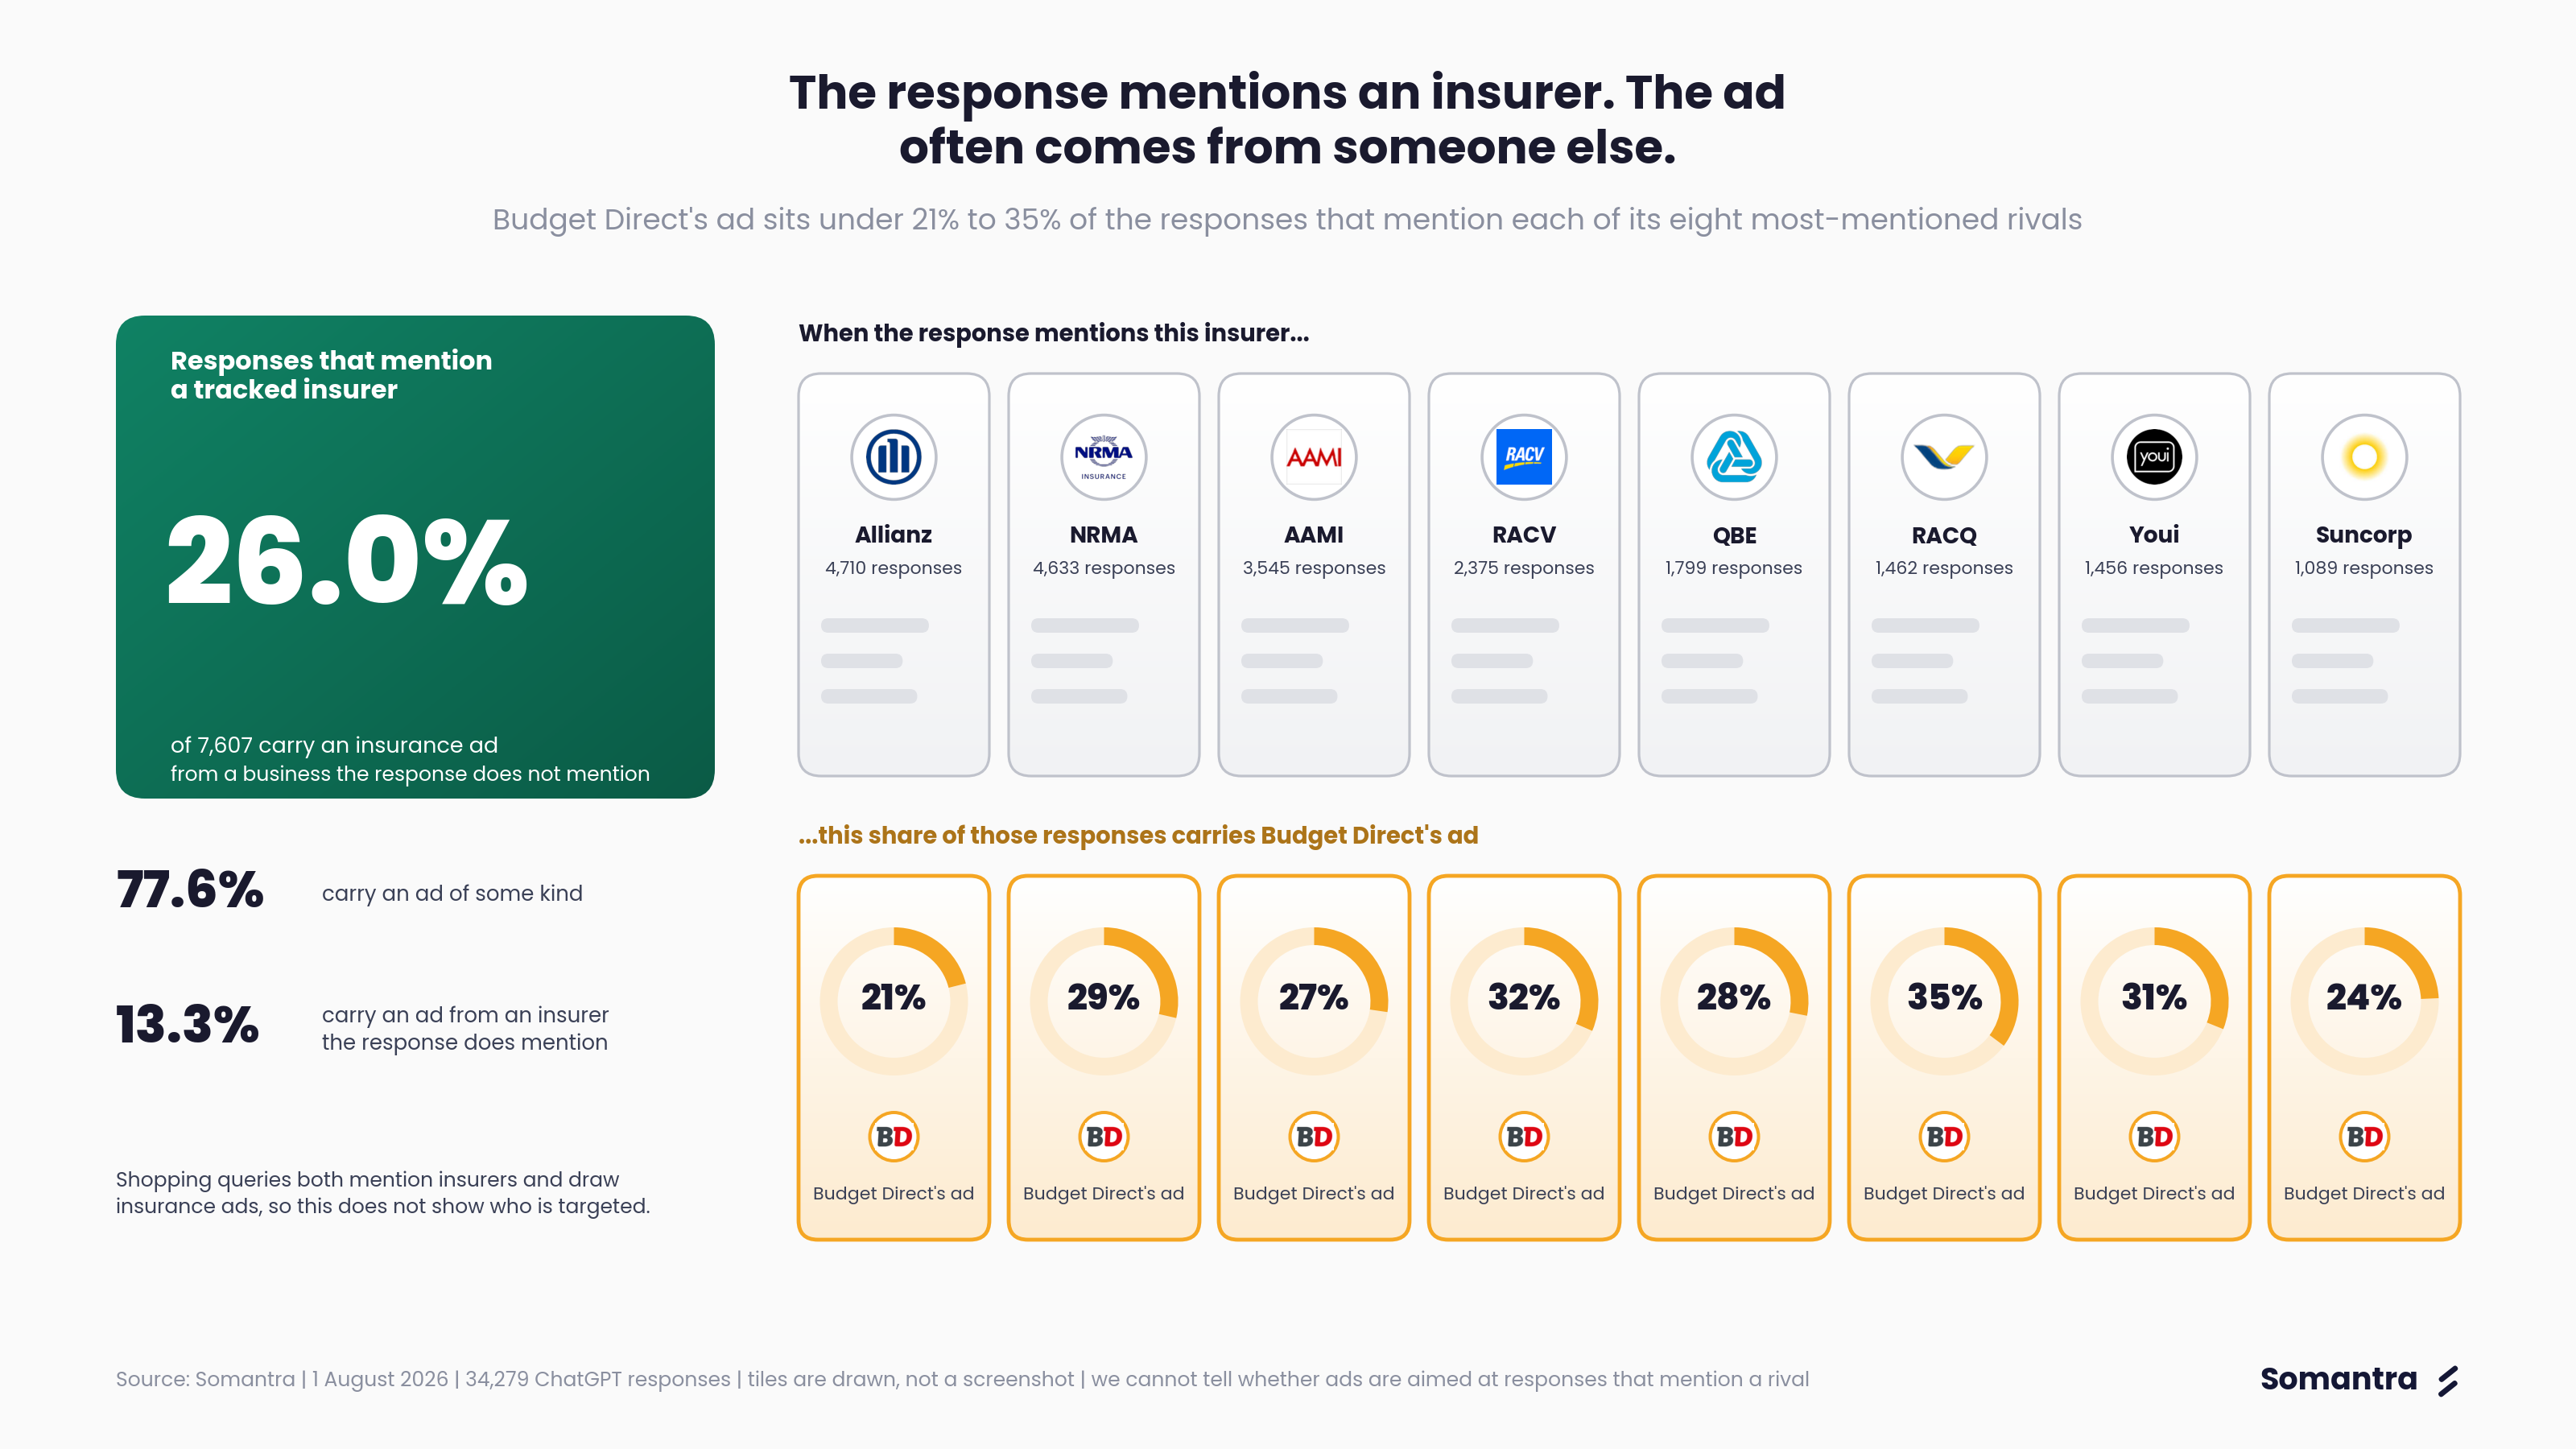
7,607 responses mention at least one of the 20 tracked insurers. Of those:
- 77.6% carry an ad of some kind.
- 26.0% carry an insurance ad from a business the response does not mention.
- 13.3% carry an ad from an insurer the response does mention.
Budget Direct’s ad sits under 21% to 35% of the responses that mention each of its eight most-mentioned rivals. Ads from rival insurance sellers rarely appear together: they share 293 responses, 0.9% of the sample.
We cannot tell whether ads are aimed at responses that mention a rival. Shopping queries both mention insurers and draw insurance ads.
See where your brand stands
ChatGPT now decides who gets mentioned, who gets recommended, and who gets advertised beneath the answer. These are three different contests, and a brand can win one while losing the others.
Somantra tracks all three across ChatGPT, Google AI Overviews, Claude and Perplexity: whether the answer recommends you over rivals, how your brand shows up at every stage of the buyer’s conversation, and where ads sit beneath the answers in your category.
Get a free brand audit to see where your brand is mentioned, chosen, and advertised against in AI search.
Frequently asked questions
How often do ads appear under ChatGPT responses to Australian insurance queries? +
In this sample, 71% of insurance responses come with an ad. 24,397 of the 34,279 responses carry at least one ad. There are 103 ads for every 100 responses, and no response carries more than three.
Who advertises under insurance responses in ChatGPT? +
ChatGPT showed 35,290 ads from 371 advertisers. Five advertisers hold 57% of the ads: Budget Direct, Jotform, Variant Group (pdf.net), Consolidated Insurances and Finder. Another 327 advertisers have fewer than 100 ads each and share 11%.
Are the ads under insurance responses for insurance? +
Mostly not. 67% of the ads are not for insurance, and only 33% sell insurance. Software firms hold 27.1% of the ads, almost as much as the insurance sector's 29.7%.
Which Australian insurers have ads selling insurance in ChatGPT? +
Of the 20 insurers we track, 1 has ads selling insurance in this sample: Budget Direct. It holds 19.9% of all ads and 60.7% of the ads that sell insurance. The other 19 have none, including the three insurers ChatGPT mentions most. This covers two days only, 1 and 3 August 2026. An insurer with no ads on those days may advertise on others.
Does the wording of a query change whether an ad appears? +
A little. Queries using "best", "top" or "recommended" are about 8 percentage points more likely to have an ad after accounting for other measured features. Queries starting with "why" are about 7 points less likely. The differences are small against a base of 76%, and they do not prove the wording caused an ad to appear.
Does ChatGPT mention the businesses that advertise under its responses? +
Rarely. In 84.9% of the responses that carry Budget Direct's ad, the response does not mention Budget Direct. Of the 10,832 responses carrying an insurance ad, 1.5% mention one of those insurance advertisers first, and in 49.2% no brand is mentioned.
What do the ads say, and where do they link? +
Each kind of advertiser has its own pitch. Insurers say "get a quote" (55.5% of their ads), comparison sites say "compare" (79.7%) and unrelated businesses say "free" (72.6%). Insurance ads almost never carry a discount: 0.2% of the ads that sell insurance. Of insurers' ads, 0.1% have a link classified as a quote page from its web address.
What are the limits of these numbers? +
We ran the audit on two separate days, 1 and 3 August 2026, from Australia, on desktop, by a user with no history. A real person's ads may differ. We see recorded ads, not results. We do not see spend, bids, clicks or sales, or how the system chooses an ad. A pattern does not prove a cause.

About the author
Arun Prasad
Founder, Somantra
Arun Prasad is the founder of Somantra, an AI search visibility platform for brands, where he writes about answer engine optimisation (AEO) and AI search. His research analyses how brands surface in AI answers across ChatGPT and Google AI Overviews, including Somantra's studies of the Australian insurance market. He focuses on measuring brand visibility through systematic, large-scale conversational testing rather than one-off screenshots.

About the author
Yajat S
Yajat S is a researcher at Somantra, where he analyses how brands surface in AI search across ChatGPT and Google. He authored Somantra's Australian insurance citation study covering 2.4 million AI search citations, focused on the content formats and URL patterns that get cited by answer engines.