
What we analysed. We audited 49,692 ChatGPT responses to TV queries in Australia, August 2026. Ads were recorded on 1,239 responses from 60 advertisers.
At a glance
- ChatGPT is now a shop. 62.8% of responses put something to buy in front of the shopper.
- Two shelves, two winners. Product cards in 24.6% of responses, led by JB Hi-Fi. Ads led by Kogan.
- The cards show a price. The TV ads don’t. 99.8% of cards do. Not one ad for a TV does.
- Ads make Kogan the most visible TV retailer. 31.5% of responses, ahead of JB Hi-Fi’s 20.2%. 79.7% of it is the ad alone.
- “Shop” ads send shoppers to a home page. 98.1% of them. Ads that ask for nothing go straight to a product page.
- TV is the most shop-like category we measured. Elsewhere, product cards appear in 2.6% of responses or fewer.
- Ask “why”, get an ad: 79%. Ask “how to”: 17%.
- Ads follow the conversation, not just the query. 4.4% of monitor ads sit under a query about monitors. 55.6% sit under a response that mentions them, against 25.5% of all responses.
1. ChatGPT is now a shop
62.8% of TV responses put something to buy in front of the shopper. Product cards, an ad, or both.
What does ChatGPT put in front of a TV shopper?
| Product cards | Ads | |
|---|---|---|
| Product Placements | Inside the response | Below the response |
| Responses that show it | 24.6% | 51.2% |
| Shows a price | 99.8% | 3.0% |
| Shows a rating, award or reviews | 85.0% | 2.8% |
| Leader | JB Hi-Fi, listed first on 16.8% of cards | Kogan, 40.7% of ads |
- The cards sell with a price and a rating. The ads mostly don’t.
Cards need a search. Ads don’t.
ChatGPT searched the web before writing 50.3% of responses.
| ChatGPT searched the web | No web search | |
|---|---|---|
| Responses | 623 | 616 |
| With product cards | 49.0% | 0.0% |
| With an ad | 50.4% | 51.9% |
- Every product card comes from a web search. No search, no cards.
- Ads don’t wait for one. About 51% either way.
- So “why” queries get ads and no cards. Of the 134 we class as “why” in section 8, ChatGPT searched for 14.2%. 79.9% carry an ad.
Ads reshape visibility
Who gets mentioned in ChatGPT's TV answers?
| Brand | Responses where it is visible | Share of that visibility that is only its ad |
|---|---|---|
| Samsung | 46.8% | 16.4% |
| LG | 33.7% | 0% |
| Kogan | 31.5% | 79.7% |
| TCL | 24.7% | 0% |
| Sony | 23.6% | 0.3% |
| Hisense | 23.2% | 0% |
| JB Hi-Fi | 20.2% | 0% |
| The Good Guys | 18.9% | 0% |
| Harvey Norman | 14.0% | 0% |
- Ads make Kogan the most visible TV retailer. 31.5% of responses. JB Hi-Fi: 20.2%. The Good Guys: 18.9%.
- Take away the ad and Kogan drops to 6.4%.
- Every other retailer here is seen without paying.
- Samsung buys a little on top of a lot. Visible in 46.8% of responses. 16.4% of that is the ad alone.
Where the click goes
Where does a click on a TV ad lead to?
| The ad asks the shopper to | Share of ads | Where the click lands most often |
|---|---|---|
| Nothing | 43.0% | A single product page (91.0%) |
| “Shop” | 25.9% | A home page (98.1%) |
| “Get” | 16.1% | A home page (94.0%) |
| “Compare” | 6.3% | A comparison or list page (94.2%) |
| Anything else | 8.7% | (mixed) |
Each ad’s main request is read from its text by written rules. “Get” is mostly Kogan’s “Get what you want for less”.
- Quiet ads go straight to the product. 91.0% of the ads that ask for nothing land on a product page. Most are Samsung’s.
- Loud ads go to the front door. 98.1% of “Shop” ads land on a home page, almost all of them Kogan’s. The shopper starts again.
Looking ahead, we’ll continue to experiment with more dynamic ad formats to increase user value (e.g. giving users the ability to talk directly to businesses through ads) and advertiser value.
OpenAI engineering blog, 21 October 2026: How we built ChatGPT’s novel ad stack for user trust and relevance.
- Today the click is the only next step. Every one of the 827 ads we recorded is a short text ad with a link. None lets the shopper talk to the business.
TV is the most shop-like category we measured
Which categories get product cards?
| TV retail | Insurance | Banking | Mobile plans | Presentation software (US) | Dishwashing products (US) | |
|---|---|---|---|---|---|---|
| Responses with an ad | 51.2% | 71.2% | 74.8% | 57.1% | 70.4% | 3.8% |
| Responses with product cards | 24.6% | 1.4% or less | 0.2% | 2.6% | 0.0% | 1.7% |
| Ads that pass through Criteo | 38.8% | 4.3% | 17.6% | 1.3% | 0.3% | 0.2% |
| Ads that link to a single product page | 41.6% | 3.5% | 4.0% | 2.0% | 2.7% | 32.3% |
| Ads whose main request is “Shop” | 25.9% | 0.2% | 0.0% | 0.0% | 0.0% | 15.2% |
| Ads whose main request is “Compare” | 6.3% | 20.6% | 32.1% | 54.5% | 1.9% | 0.3% |
| Ads that show a dollar price | 3.0% | 0.9% | 4.7% | 7.2% | 0.3% | 0.1% |
One audit per panel. Australian panels: 1 to 26 August 2026. US panels: 18 to 19 August and 21 May. Panels differ in size and date, so read the direction, not the decimals. The insurance card figure is an upper bound.
- Only TV shows product cards at scale. 24.6% of responses. Elsewhere: 2.6% or less.
- TV ads look like a shop shelf. Finance and telco ads look like a comparison site. “Compare” is the main request in 32.1% of banking ads and 54.5% of mobile plan ads.
- Ads under TV queries rarely show a price. 3.0% do. Mobile plan ads: 7.2%.
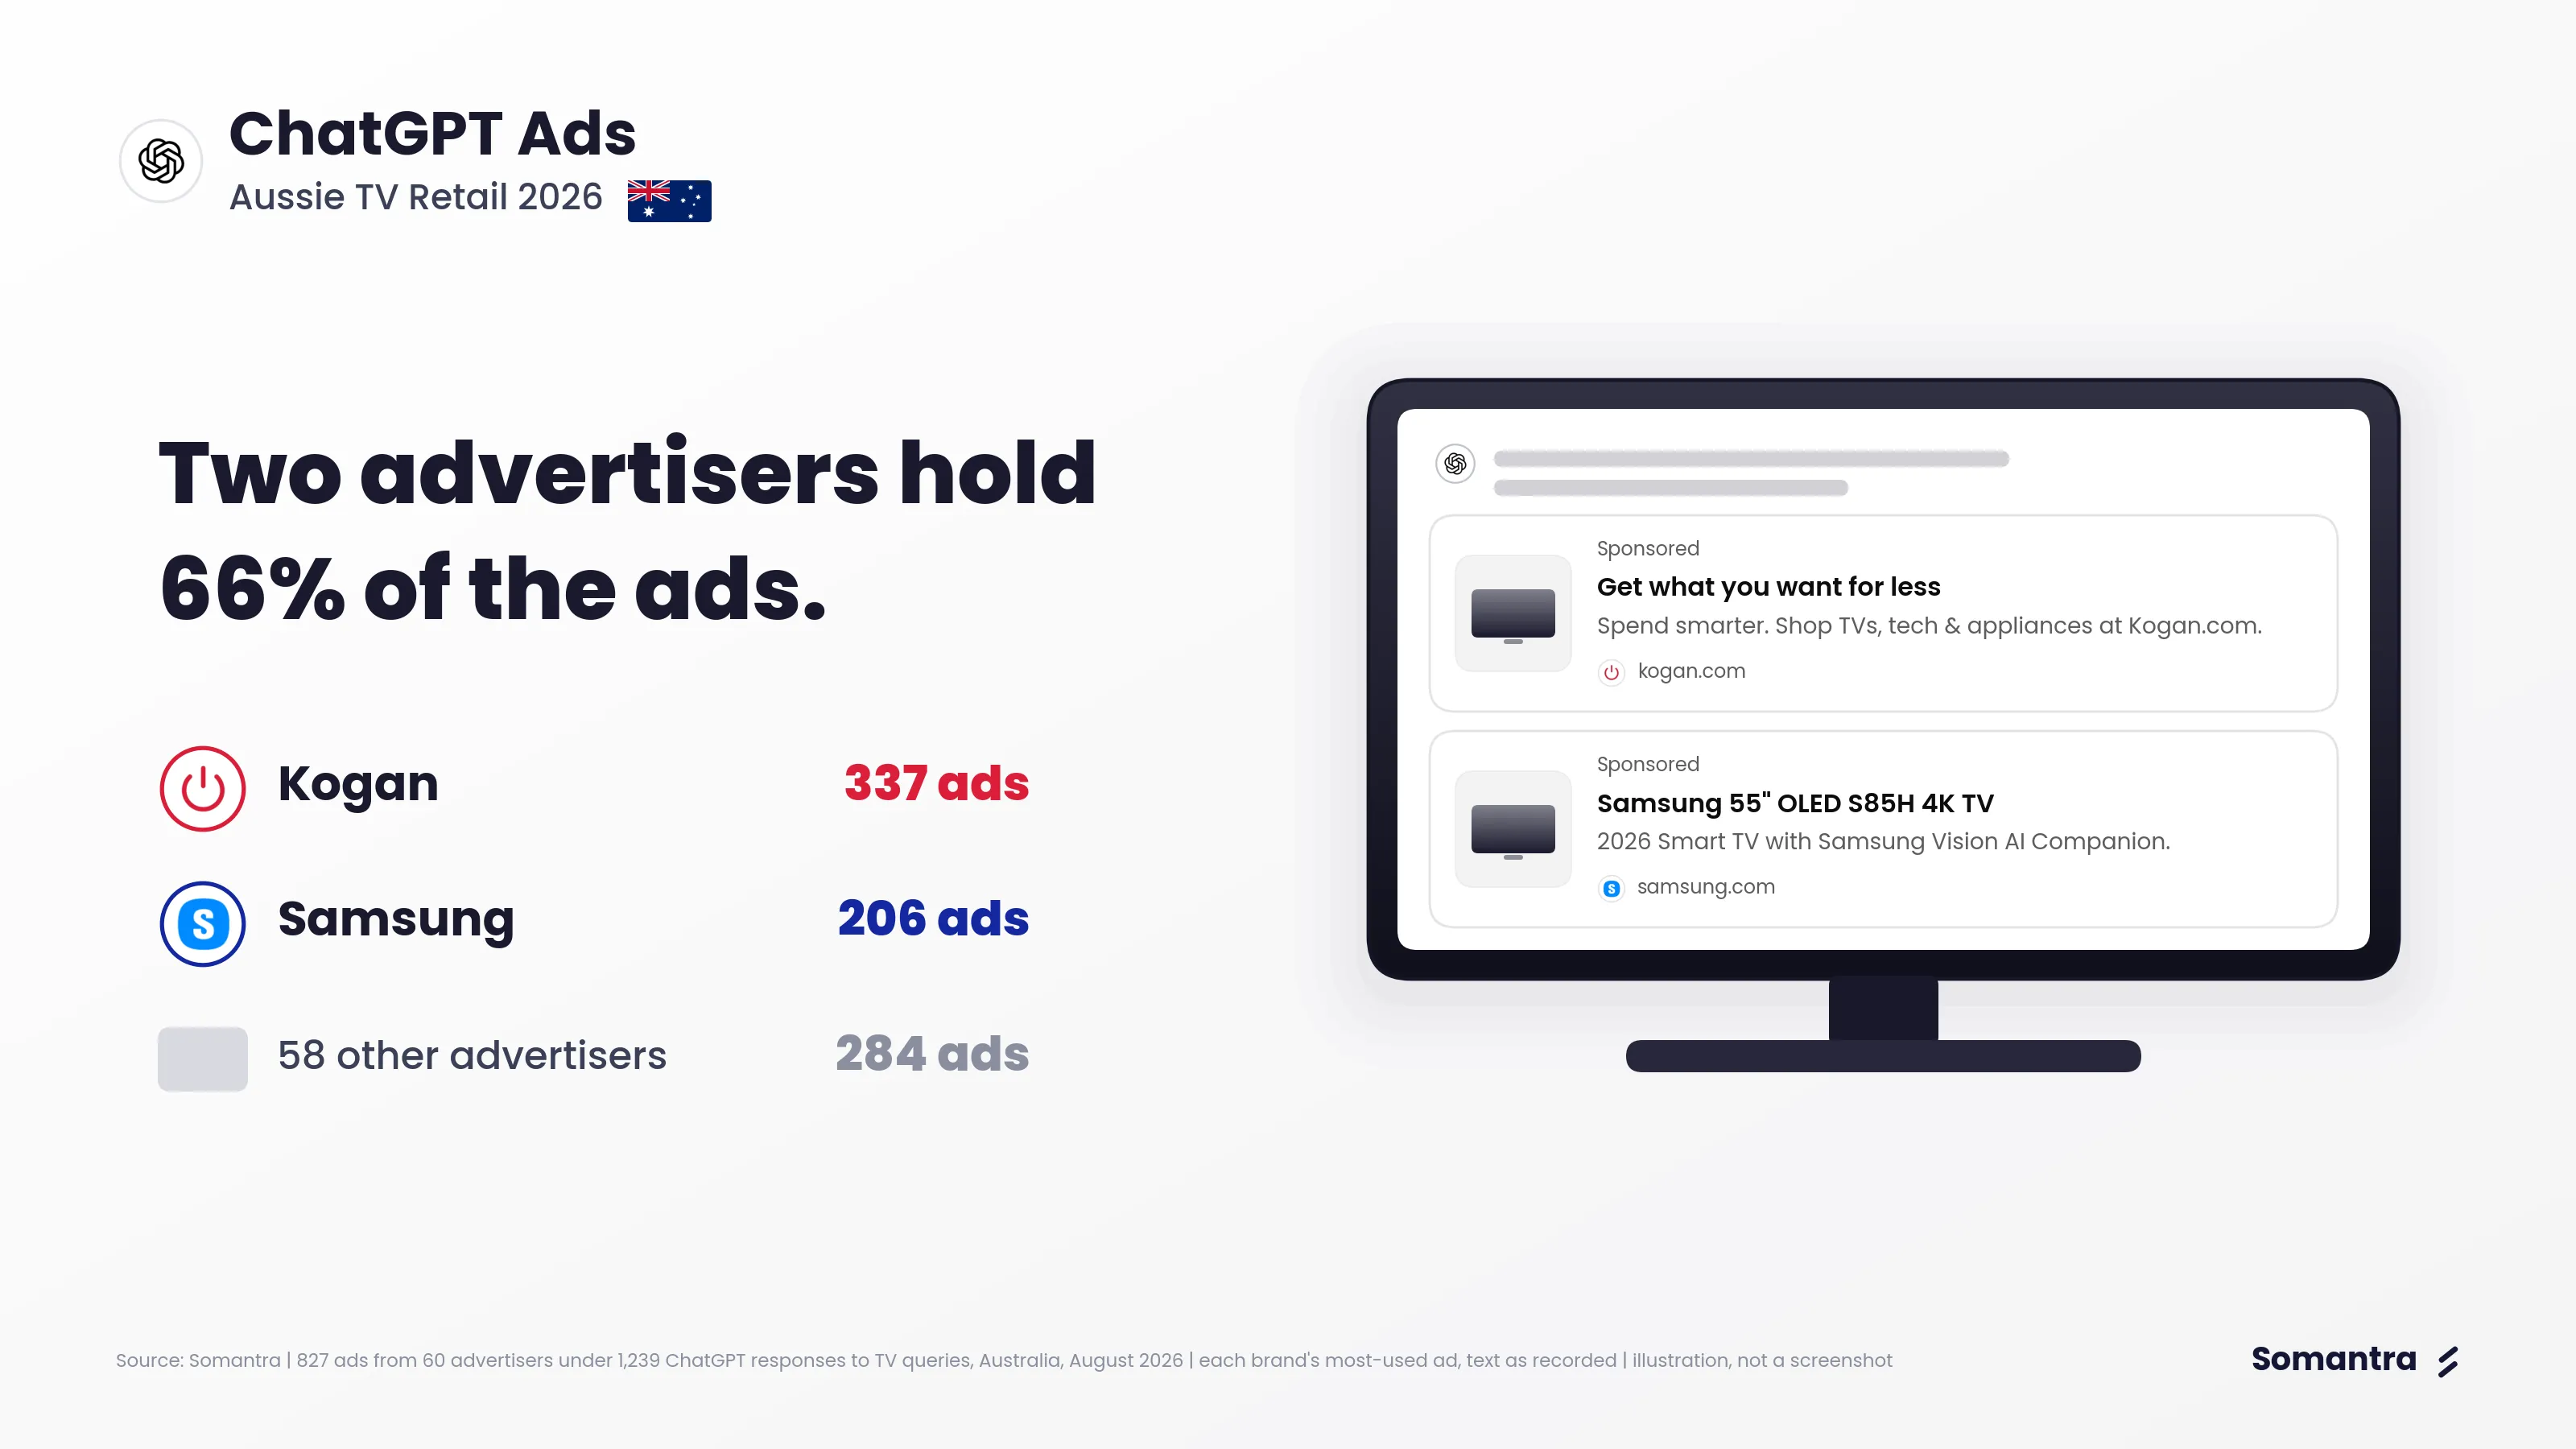
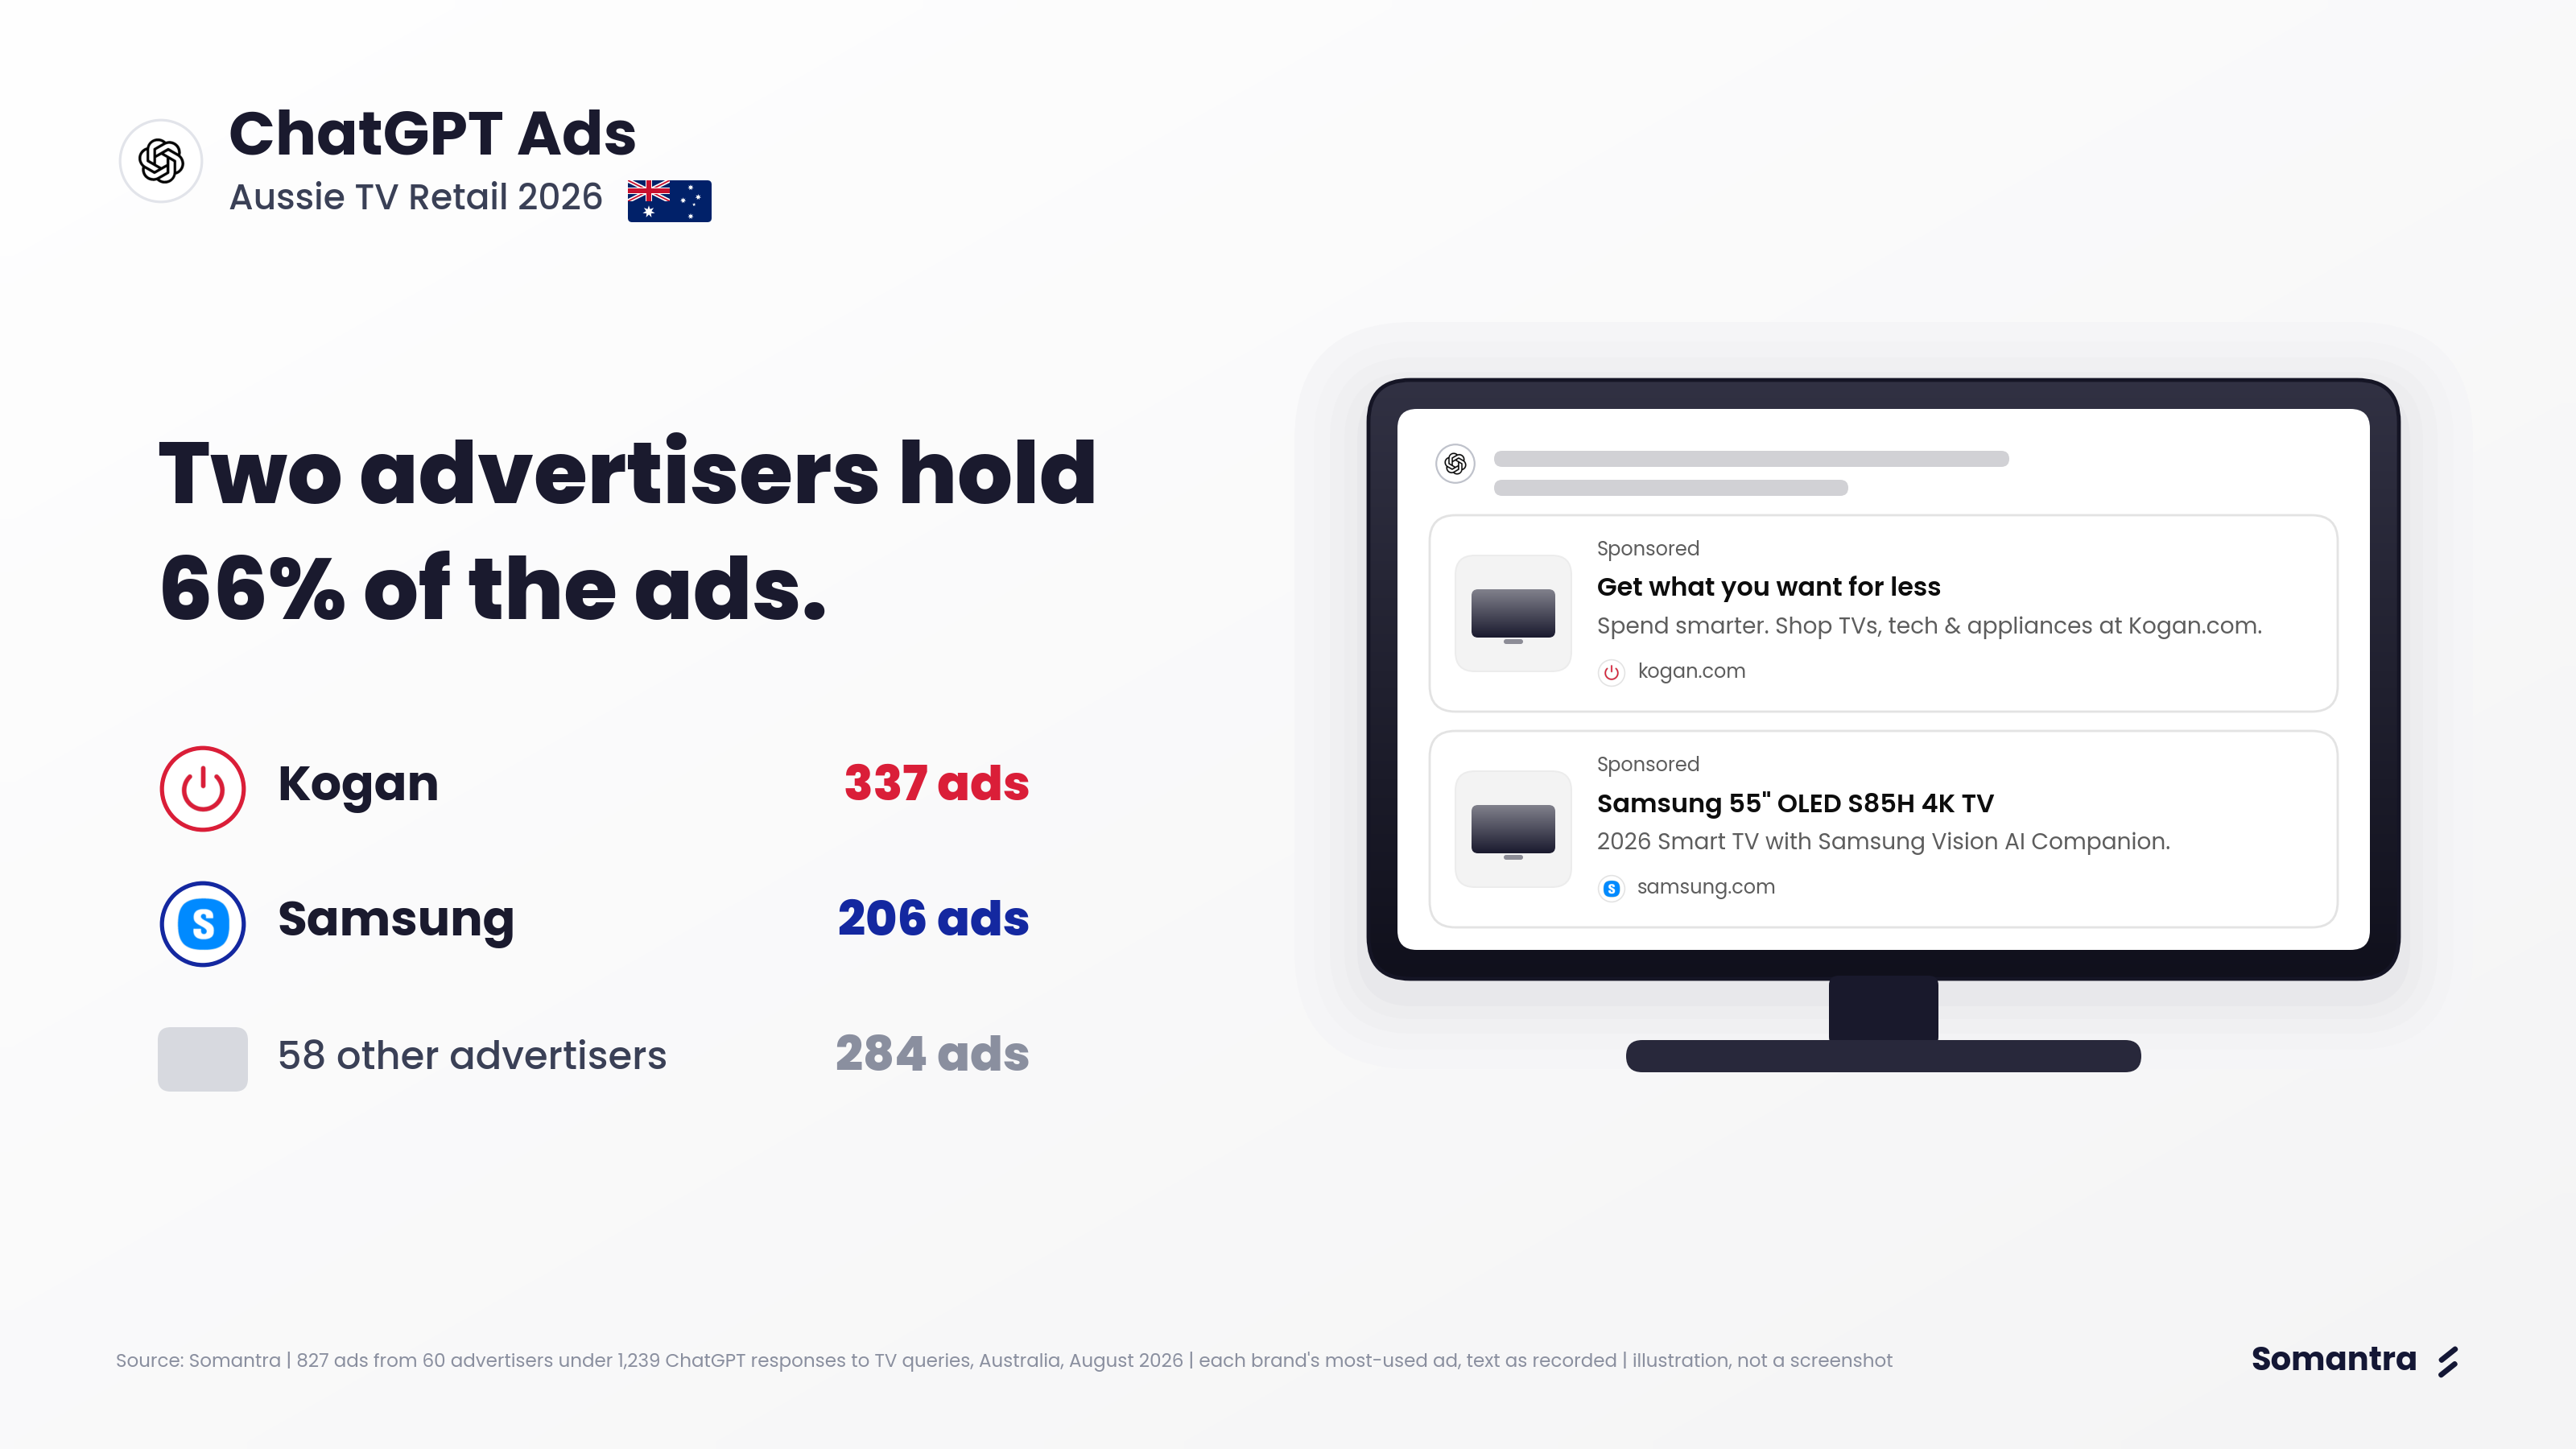
2. Two advertisers hold 66% of the ads
Who buys the space under ChatGPT's TV answers?
| Advertiser | What it is | Ads | Share of all ads | Responses with its ad |
|---|---|---|---|---|
| Kogan | Online retailer | 337 | 40.7% | 27.1% |
| Samsung | TV maker | 206 | 24.9% | 12.9% |
| Finder | Comparison site | 60 | 7.3% | 3.7% |
| Lenovo | Computer maker | 28 | 3.4% | 2.0% |
| Scorptec | Computer retailer | 23 | 2.8% | 1.5% |
Ranked by ads seen. We cannot see what anyone spent.
| Advertisers with | How many | Share of all ads |
|---|---|---|
| 100 ads or more | 2 | 65.7% |
| 10 to 99 | 8 | 21.2% |
| 2 to 9 | 19 | 9.4% |
| 1 ad | 31 | 3.7% |
- Kogan’s ad sits under 27.1% of all responses. That is 53.0% of every response with an ad.
- Samsung often shows more than one product. 206 ads under 160 responses.
3. Ads Based on TV Topics
Topic barely moves the ad rate.
| Topic group | Responses | With an ad | Ads per 100 responses | Largest advertiser (share of the group’s ads) |
|---|---|---|---|---|
| Screen size | 71 | 56% | 68 | Kogan (50%) |
| Deals and sales | 200 | 56% | 71 | Kogan (49%) |
| Accessories and home theatre | 123 | 55% | 82 | Samsung (27%) |
| Cheap and under a price | 261 | 52% | 64 | Kogan (42%) |
| Screen technology | 154 | 52% | 70 | Kogan (39%) |
| Smart TV and streaming | 118 | 48% | 65 | Kogan (40%) |
| Buying and delivery | 57 | 47% | 56 | Kogan (50%) |
| Best TV and buying guides | 109 | 47% | 58 | Kogan (49%) |
| TV for a use (gaming, sport, movies, caravans) | 146 | 45% | 61 | Kogan (35%) |
- No topic stands out. Every group sits between 45% and 56%.
- Kogan leads eight of the nine groups. Accessories is the exception.
- TV ads follow the buying topics. 50.5% of Deals and sales responses carry an ad for a TV, soundbar, projector or streaming device. TV for a use: 27.4%.
- Broad or detailed, same rate. 51.1% of the 47 broad queries. 51.2% of the 1,188 detailed ones.
4. “Why” gets an ad. “How to” rarely does.
The topic matters little. The wording matters a lot.
Which TV queries get an ad?
| Query opens with | Responses | With an ad | Ads per 100 responses |
|---|---|---|---|
| ”Why” | 183 | 79% | 108 |
| ”What” | 440 | 70% | 92 |
| Anything else | 198 | 57% | 71 |
| ”How to” or “how do” | 418 | 17% | 20 |
The gap holds in every topic group
| Topic group | ”How to” queries with an ad | ”Why” queries with an ad |
|---|---|---|
| Screen size | 15% | 100% |
| Deals and sales | 20% | 91% |
| Accessories and home theatre | 17% | 71% |
| Cheap and under a price | 22% | 81% |
| Screen technology | 18% | 75% |
| Smart TV and streaming | 11% | 71% |
| Buying and delivery | 16% | 83% |
| Best TV and buying guides | 16% | 67% |
| TV for a use (gaming, sport, movies, caravans) | 8% | 74% |
Each “why” figure rests on 12 to 41 responses and each “how to” figure on 19 to 92, so single cells are rough. The direction is the same in all nine groups.
- Buying intent doesn’t close the gap. In Deals and sales, “how to”: 20%. “Why”: 91%.
How much real use looks like this
OpenAI publishes what Australians use ChatGPT for. The nearest match to our ad-heavy “why” and “what” queries is “seeking information”. The nearest match to our ad-light “how to” queries is “practical guidance”.
How much of real ChatGPT use is the kind that gets ads?
| Australian ChatGPT messages, April to June 2026 | All messages | Personal messages |
|---|---|---|
| Practical guidance, which includes “how to” advice | 31.4% | 35.4% |
| Writing | 27.1% | 15.9% |
| Seeking information, which includes shopping | 20.3% | 25.7% |
| Everything else | 21.2% | 23.1% |
Source: OpenAI Signals, consumer ChatGPT accounts on all plans, averaged over the quarter. The topics are OpenAI’s, not ours, so the match is approximate.
- The kind of query where TV ads cluster is 20.3% of real use. That is seeking information. It is 25.7% of personal messages.
- The biggest use is where ads are rare. Practical guidance, home of “how to”, is 31.4%.
- Australians seek information more than most. 20.3%, up from 14.9% in July to September 2024. That ranks 35th of 128 countries. Global: 18.5%.
- OpenAI also sorts messages by what they ask for. 51.1% of Australians’ personal messages ask for information or advice, the kind these ads sit under. Global: 47.4%.
We then tested 21 query features at once.
Which words in a query come with more ads?
| Feature of the query | Responses with this feature | Ad rate: with / without the feature | Adjusted difference in ad rate, points |
|---|---|---|---|
| Starts with “why” | 183 | 79%, 46% | +19.8 |
| Starts with “what” | 440 | 70%, 41% | +14.1 |
| Gives a screen size | 350 | 57%, 49% | +8.8 |
| ”best”, “top” or “recommended” | 167 | 58%, 50% | -8.4 |
| Starts with “how to” or “how do” | 418 | 17%, 69% | -40.9 |
Middle column: observed rates. Last column: the difference once the other features are accounted for. All passed our statistical checks. None proves the wording caused it.
- “How to” is the biggest difference in the data, by far. 17% against 69%.
- “Why” and “what” draw the most ads. Insurance was the reverse.
- “Best” adds nothing. 74% of “best” queries start with “what”. Among “what” queries, the “best” ones have fewer ads: 63% against 73%.
- Shopping words don’t decide whether an ad appears. No clear link for deal, price, compare, a city, a year, gaming, cables, sound, streaming, energy or warranty.
- Wording predicts ads far better than in insurance. It picks the response with an ad 80% of the time. Insurance: 58%. A coin toss: 50%.
Shopping words do shape the kind of ad. For ads selling a TV, soundbar, projector or streaming device (38% of responses):
| Feature of the query | Responses with this feature | Rate: with / without the feature | Adjusted difference, points |
|---|---|---|---|
| Starts with “why” | 183 | 61%, 34% | +17.6 |
| ”deal”, “sale”, “cheap” or “discount” | 144 | 51%, 37% | +13.2 |
| Gives a screen size | 350 | 48%, 35% | +13.0 |
| Starts with “what” | 440 | 52%, 31% | +11.8 |
| Mentions a year | 114 | 49%, 37% | +9.2 |
| About mounts, brackets or stands | 107 | 16%, 40% | -23.1 |
| Starts with “how to” or “how do” | 418 | 12%, 52% | -30.2 |
5. What the ads sell, sector by sector
In insurance, 33% of the ads sold insurance. Here the ads stay close to the subject.
| What the ad offers | Ads | Share of ads | Advertisers | Largest advertisers |
|---|---|---|---|---|
| A TV | 502 | 60.7% | 6 | Kogan (337), Samsung (155) |
| A soundbar, projector or streaming device | 39 | 4.7% | 6 | Samsung (27), Scorptec (6) |
| A TV accessory or TV furniture | 80 | 9.7% | 16 | Gainsville Furniture (18), Scorptec (13), Lenovo (11) |
| A monitor or display | 45 | 5.4% | 6 | Samsung (21), Lenovo (16) |
| Broadband, energy or a VPN | 84 | 10.2% | 7 | Finder (60), Econnex (10), ExpressVPN (9) |
| A service | 19 | 2.3% | 7 | Airtasker (9), Holloway Removals & Storage (5) |
| Something else | 58 | 7.0% | 31 | Capterra (13), EcoFlow (5) |
- 65.4% sell a TV, soundbar, projector or streaming device. Add accessories and furniture: 75.1%.
- 337 of the 502 TV ads are Kogan’s range ad. The other 165 show a specific TV.
- Ads that show a specific TV, soundbar, projector or streaming device: 24.7%. The rest of the 65.4% is Kogan’s range ad.
- 7.0% have no link to TVs that we could find. Software lists. An airfryer. A hotel. A power station.
| Sector | Advertisers | Ads | Share of ads | Largest advertiser (share of the sector’s ads) | Ads for a TV, soundbar, projector or streaming device |
|---|---|---|---|---|---|
| Electronics retailers | 7 | 388 | 46.9% | Kogan (86.9%) | 89.7% |
| TV and electronics makers | 6 | 243 | 29.4% | Samsung (84.8%) | 75.3% |
| Comparison sites | 3 | 83 | 10.0% | Finder (72.3%) | 0.0% |
| Other retailers and marketplaces | 13 | 35 | 4.2% | AliExpress (20.0%) | 28.6% |
| Furniture and furnishings | 7 | 26 | 3.1% | Gainsville Furniture (69.2%) | 0.0% |
| Software and online services | 9 | 23 | 2.8% | ExpressVPN (47.8%) | 0.0% |
| Home services and trades | 8 | 20 | 2.4% | Airtasker (45.0%) | 0.0% |
| Insurance | 2 | 4 | 0.5% | Budget Direct (75.0%) | 0.0% |
| Energy and telco | 3 | 3 | 0.4% | (one ad each) | 0.0% |
| Travel | 2 | 2 | 0.2% | (one ad each) | 0.0% |
| All | 60 | 827 | 100% | Kogan (40.7%) | 65.4% |
“Sector” describes the advertiser’s business, not what each ad sells.
Sector by sector
- Electronics retailers (46.9% of ads). Kogan is 86.9% of it. Six specialist stores show single products: Scorptec (23), Centre Com (12), MegaBuy, Klika, Ink Station and Wagner Electronics.
- TV and electronics makers (29.4%). Samsung has 206 of the 243. Lenovo (28) sells other brands’ displays, mounts and cables. Sony has one ad.
- Comparison sites (10.0%). Finder (60) advertises broadband and energy plans, not TVs. Econnex does the same. Capterra advertises software lists.
- Other retailers and marketplaces (4.2%). AliExpress LED strips, Anaconda, Harris Scarfe, Bunnings brackets, and camping stores selling 12 volt TVs.
- Furniture and furnishings (3.1%). Gainsville Furniture shows one TV unit 18 times, with its price.
- Software and online services (2.8%). ExpressVPN, with one ad per streaming service.
- Home services and trades (2.4%). Airtasker handymen under wall mount queries. Removalists under delivery queries.
- Insurance (0.5%). Budget Direct and Allianz, under warranty queries.
We classified advertisers by name or known brand, then by their ad text and link. We did not open any advertiser’s page.
6. Kogan repeats one line. Samsung shows 52 products.
The two biggest advertisers play opposite games.
How do Kogan and Samsung write their ads?
| Kogan | Samsung | |
|---|---|---|
| Ads | 337 | 206 |
| Versions of ad text | 6 | 52 |
| Pages the ads link to | 2 | 52 |
| Most common link | Home page (99.1%) | A single product page (100%) |
| Share of ads that ask the reader to act | 100% | 0% |
| Passes through Criteo | No | Every ad |
- Kogan says one thing everywhere. “Get what you want for less. Spend smarter. Shop TVs, tech & appliances at Kogan.com.” That line is 62.3% of its ads.
- Kogan’s ad reaches 92.3% of the topics. Samsung’s: 73.6%. No one else passes 31.9%.
- Samsung shows a different product each time. One product, one page. No request to act. No price.
- When both appear, Kogan goes first. In 85.7% of the 21 responses that carry both.
Samsung is not alone. 321 ads from 19 advertisers pass through Criteo, an outside advertising service.
| Ads that link straight to the advertiser | Ads that pass through Criteo | |
|---|---|---|
| Ads | 504 | 321 |
| Advertisers | 39 | 19 |
| Versions of ad text | 73 | 122 |
| Pages linked to | 68 | 122 |
| Link to a single product page | 4.6% | 100% |
| Ask the reader to act | 91.5% | 0.3% |
| Show a dollar price | 5.0% | 0% |
Two more ads pass through a second service, StackAdapt.
- 38.8% of all ads pass through Criteo. In insurance: 4.3%.
- Every Criteo ad shows one product and links to its page. That suggests ads built from a retailer’s product list. We cannot see how they are made.
Product ads follow the query
For ads that are not for a TV: is the query about what the ad offers?
| The ad offers | Ads | Query is about the same thing | Share of all queries about it |
|---|---|---|---|
| A handyman, electrician or installer | 11 | 100% | 12% |
| A TV mount or bracket | 17 | 94% | 8% |
| An HDMI cable or switch | 25 | 92% | 8% |
| An energy plan | 28 | 89% | 4% |
| A soundbar or speakers | 30 | 80% | 9% |
| A broadband plan | 44 | 52% | 7% |
| A TV unit or furniture | 24 | 33% | 8% |
| A monitor or display | 45 | 4% | 1% |
| A VPN | 11 | 0% | 6% |
The last column is the share of all queries about that thing: the middle column if ads ignored the query.
- Accessory ads find accessory queries. 94% of mount ads. 92% of cable ads.
- Monitor and VPN ads miss the query. Monitor ads match the response instead (section 10). VPN ads match nothing.
- Ask for a size, get that size 53% of the time. By chance: 9%. This rests on 59 TV ads, 57 of them Samsung’s. Example: “What are the box dimensions and weight of a typical 55 inch TV” carried “Samsung 55” OLED S85H 4K TV”.
7. Ads Narrative
827 ads. 197 versions of ad text.
The message
Each kind of advertiser has its own pitch. “Other retailers” covers department stores, marketplaces, furniture and camping stores. “Services and utilities” covers trades, removalists, energy and telco. “Unrelated businesses” describes the advertiser, not each ad. Headings show ad counts.
What does each kind of advertiser say?
| Share of ads that | TV and electronics makers (243) | Electronics retailers (388) | Other retailers (61) | Comparison sites (83) | Services and utilities (23) | Unrelated businesses (29) | All ads (827) |
|---|---|---|---|---|---|---|---|
| Ask the reader to act | 0.0% | 87.1% | 37.7% | 89.2% | 60.9% | 48.3% | 56.0% |
| Make a price or value claim | 0.0% | 86.9% | 1.6% | 31.3% | 34.8% | 13.8% | 45.5% |
| Show a dollar price | 0.4% | 0.0% | 29.5% | 3.6% | 4.3% | 6.9% | 3.0% |
| Mention a sale, deal or offer | 0.4% | 0.0% | 0.0% | 45.8% | 4.3% | 10.3% | 5.2% |
| Say “compare” | 0.0% | 0.0% | 0.0% | 59.0% | 4.3% | 6.9% | 6.3% |
| Say “free” | 0.4% | 0.0% | 1.6% | 14.5% | 30.4% | 10.3% | 2.9% |
| Mention an award, rating or reviews | 0.0% | 0.0% | 0.0% | 20.5% | 26.1% | 0.0% | 2.8% |
| Show a screen size | 81.9% | 2.8% | 18.0% | 0.0% | 0.0% | 0.0% | 26.7% |
| Link to a single product page | 99.6% | 12.9% | 83.6% | 0.0% | 0.0% | 3.4% | 41.6% |
- Makers show the product. Retailers say “for less”. Comparison sites say “compare”. Trades say “free quote”.
- Not one ad for a TV shows a price or a sale. Not even under deals queries. Of the 142 ads under Deals and sales responses, 3 mention a deal. All 3 are Finder’s broadband ads.
- Makers ask for nothing. None of their 243 ads.
How the main advertisers place ads
| Advertiser | Ads | Ad versions | Linked pages | Most common ad text (share of its ads) | Approach |
|---|---|---|---|---|---|
| Kogan (online retailer) | 337 | 6 | 2 | ”Get what you want for less. Spend smarter. Shop TVs, tech & appliances at Kogan.com.” (62.3%) | One price message for every query. 99.1% link to the home page |
| Samsung (TV maker) | 206 | 52 | 52 | ”Samsung 55” OLED S85H 4K TV. 2026 Smart TV with Samsung Vision AI Companion.” (12.6%) | One product per ad, each with its own page. No price, no request to act |
| Finder (comparison site) | 60 | 7 | 7 | ”Check out Unlimited Broadband plans via Finder. Compare broadband plans from leading ISPs in Australia.” (46.7%) | Broadband under streaming queries, energy under power queries |
| Lenovo (computer maker) | 28 | 13 | 13 | ”Samsung QM43C 43” 4K Display” (21.4%) | Other brands’ products from its accessories store |
| Scorptec (computer retailer) | 23 | 15 | 15 | ”Ugreen 3M 8K UHD HDMI 2.1 Male to Male Cable” (30.4%) | Cables, mounts and projectors, one product per ad |
| Gainsville Furniture | 18 | 1 | 1 | ”Ava TV Unit. Handcrafted curved TV unit in American Walnut or Black Oak, ceramic top. From $1,695. Enquire now.” (100%) | One product, with its price |
| ExpressVPN | 11 | 7 | 5 | ”Best VPN for Prime Video. Fast VPN servers for Prime Video. No throttling.” (27.3%) | One ad for each streaming service |
| Airtasker (services marketplace) | 9 | 4 | 3 | ”Hire an Affordable Handyman. Get free quotes from trusted local handymen near you” (55.6%) | A handyman under wall mount queries |
- 38 of the 60 advertisers use a single version of ad text. Samsung uses 52.
Call to Actions
| Linked page | TV and electronics makers | Electronics retailers | Other retailers | Comparison sites | Services and utilities | Unrelated businesses | All ads |
|---|---|---|---|---|---|---|---|
| Single product page | 99.6% | 12.9% | 83.6% | 0.0% | 0.0% | 3.4% | 41.6% |
| Home page | 0.0% | 86.3% | 4.9% | 0.0% | 8.7% | 10.3% | 41.5% |
| Comparison or list page | 0.0% | 0.0% | 0.0% | 100.0% | 0.0% | 3.4% | 10.2% |
| Category or range page | 0.0% | 0.8% | 11.5% | 0.0% | 78.3% | 58.6% | 5.4% |
| Campaign landing page | 0.0% | 0.0% | 0.0% | 0.0% | 8.7% | 24.1% | 1.1% |
| Hidden behind a tracking link | 0.4% | 0.0% | 0.0% | 0.0% | 4.3% | 0.0% | 0.2% |
Page types are inferred from the web addresses. We did not open the links.
- An even split. 41.6% of ads land on a product page. 41.5% on a home page.
- The home pages are Kogan’s. 334 of the 343.
- Product pages, rarely a price. 19 of the 344 product-page ads show one.
How the links are tracked
- 57.2% of ads carry tracking tags. Every tag mentions ChatGPT or OpenAI.
- The channel name is close to standard.
chatgptis the source on 93.9% of tagged ads. In insurance, three names split the field. - The most common traffic label is
cpc, cost per click. It is on 90.5% of tagged ads. A label, not proof of how the ads were priced. - Kogan’s campaign is named “Brand” on 334 of its 337 ads. Finder’s campaign names include “Search”.
- 39.1% pass through an outside ad service: Criteo (321 ads) and StackAdapt (2). 3.7% have neither tags nor a service.
We classified messages using written rules, so these percentages are estimates.
8. The cards show the price. The TV ads don’t.
| Share of all responses | |
|---|---|
| Product cards and an ad | 13.0% |
| An ad, no product cards | 38.2% |
| Product cards, no ad | 11.6% |
| Neither | 37.2% |
- 24.6% of responses show product cards. 1,288 cards, usually four per response.
- With cards or without, the ad rate is the same. 52.8% against 50.6%.
- 99.8% of cards show a price. 50% of them are priced under $993. Not one ad for a TV shows a price.
- Give a dollar budget, get priced cards, not priced ads. 86.0% of the 43 queries that give a dollar amount show cards, every one priced. None of the 25 ads under them shows a price.
Cards go to shopping queries. Ads go further.
Which queries get product cards, and which get ads?
| Type of query | Responses | With an ad | With product cards |
|---|---|---|---|
| ”Why” | 134 | 79.9% | 0.0% |
| “What is” or “what are” | 177 | 73.4% | 13.6% |
| “Best” or “top” | 109 | 62.4% | 50.5% |
| “Compare” or “vs” | 114 | 55.3% | 8.8% |
| Deal, sale or price | 245 | 54.3% | 57.1% |
| Where to buy or delivery | 64 | 43.8% | 15.6% |
| “How to” | 283 | 15.2% | 8.8% |
| All responses | 1,239 | 51.2% | 24.6% |
Each query is given one type here, so a “how to” query about deals counts as a deals query. That is why the “how to” row differs from section 4. Warranty queries and queries of no set type are not shown.
- Cards come out for buying. 50.5% of “best” responses. 57.1% of deal and price responses.
- Ads also reach research. 79.9% of “why” responses carry an ad. None shows a card.
- Kogan is there too. Its ad sits under 40.3% of “why” responses, its highest for any type of query.
JB Hi-Fi leads the cards, with no ads
Each card lists one store first. 79.7% list more than one.
| Store listed first on the card | Share of product cards | Ads under its own name |
|---|---|---|
| JB Hi-Fi | 16.8% | 0 |
| The Good Guys | 9.0% | 0 |
| Harvey Norman | 7.3% | 0 |
| Costco | 5.7% | 0 |
| Bi-Rite | 5.6% | 0 |
| Amazon | 4.8% | 0 |
| Kogan | 4.4% | 337 |
| Appliances Online | 4.0% | 0 |
- JB Hi-Fi is listed first on 16.8% of cards. It is on the cards of 48.5% of the responses that show any.
- The six stores listed first most often have no ads. Kogan: seventh on the cards, first in the ads.
Four makers split the cards almost evenly.
| Maker | Share of product cards | Ads under its own name |
|---|---|---|
| Hisense | 16.3% | 0 |
| TCL | 16.0% | 0 |
| Samsung | 15.5% | 206 |
| LG | 14.5% | 0 |
| Sony | 6.1% | 1 |
| Kogan’s own brand | 4.0% | 337, for its store |
What the cards show beside an ad
- Samsung. In 55.3% of the 47 responses with Samsung’s ad and cards, the cards include a Samsung product. In 38.3%, only other makers’.
- Kogan. In 87.6% of the 97 responses with Kogan’s ad and cards, the cards list only other stores, most often JB Hi-Fi (49 of the 97).
9. The most-mentioned retailers don’t advertise
We track 20 retailers and 8 TV makers. A brand can show up without an ad in three ways: a mention, a product card, or a cited site.
Do the retailers ChatGPT mentions buy the ads?
| Retailer | Responses that mention it | Product cards listing it first | Responses citing its site | Ads | Responses with its ad |
|---|---|---|---|---|---|
| The Good Guys | 12.2% | 9.0% | 8.6% | 0 | 0% |
| JB Hi-Fi | 11.3% | 16.8% | 3.7% | 0 | 0% |
| Harvey Norman | 9.7% | 7.3% | 4.0% | 0 | 0% |
| Amazon | 5.4% | 4.8% | 0.7% | 0 | 0% |
| Bing Lee | 4.9% | 0.2% | 1.0% | 0 | 0% |
| Appliances Online | 4.5% | 4.0% | 5.1% | 0 | 0% |
| Kogan | 4.4% | 4.4% | 1.3% | 337 | 27.1% |
| Costco | 2.3% | 5.7% | 0.2% | 0 | 0% |
| TV maker | Responses that mention it | Product cards showing its products | Responses citing its site | Ads | Responses with its ad |
|---|---|---|---|---|---|
| Samsung | 37.1% | 15.5% | 7.1% | 206 | 12.9% |
| LG | 32.6% | 14.5% | 4.0% | 0 | 0% |
| TCL | 23.2% | 16.0% | 3.3% | 0 | 0% |
| Sony | 22.4% | 6.1% | 2.7% | 1 | 0.1% |
| Hisense | 21.2% | 16.3% | 0.7% | 0 | 0% |
- The most-mentioned retailers are not the ones that advertise. The Good Guys, JB Hi-Fi and Harvey Norman hold 55.2% of retailer mentions and none of the 449 retailer ads. Kogan holds 7.3% of the mentions and 75.1% of those ads.
- The Good Guys’ site is cited as often as the top review sites. 8.6% of responses. TechRadar: 8.5%. RTINGS: 8.2%.
- Samsung is the only maker advertising at scale. LG, TCL and Hisense are each mentioned in more than 21% of responses. No ads.
- Samsung products also turn up in other sellers’ ads. 23 ads from Lenovo, Klika, MegaBuy and Scorptec.
One day only. A retailer with no ads that day may advertise on other days.
10. Context Hints: what each ad seems to be matched to
Advertisers describe, in plain words, the conversations their product suits. These are context hints. Only the advertiser sees them. But where the ads land suggests what was asked for.
We read three places: the query, ChatGPT’s own web searches, and the response.
Where the query is silent, the response often speaks
Do ads match the query or the response?
| The ad offers | Ads | The query is about it | ChatGPT’s searches are about it | The response is about it | All responses about it |
|---|---|---|---|---|---|
| A monitor or display | 45 | 4.4% | 4.4% | 55.6% | 25.5% |
| A handyman, electrician or installer | 11 | 27.3% | 27.3% | 54.5% | 13.9% |
| A broadband plan | 44 | 4.5% | 2.3% | 27.3% | 16.5% |
| A TV unit or furniture | 24 | 8.3% | 4.2% | 20.8% | 7.2% |
| A soundbar or speakers | 30 | 63.3% | 43.3% | 83.3% | 24.0% |
| An energy plan or solar quote | 28 | 82.1% | 17.9% | 85.7% | 7.2% |
| An HDMI cable or switch | 25 | 88.0% | 32.0% | 92.0% | 41.0% |
| A TV mount or bracket | 17 | 94.1% | 52.9% | 100% | 16.4% |
| A VPN | 11 | 0% | 0% | 0% | 1.9% |
“About it” means the text uses words for that thing, from a stricter list than section 6. The last column is the share of all responses using those words: the response column if ads ignored the conversation. Several rows rest on 11 to 30 ads.
- For accessories, the query is enough. It matches 82.1% to 94.1% of energy, cable and mount ads.
- Where the query is silent, the response speaks. Monitor ads: 4.4% of queries, 55.6% of responses, against 25.5% for all responses. Handyman ads: 27.3% and 54.5%.
- ChatGPT’s own searches never beat the query.
- VPN ads match nothing we can see.
We use our post-trained LLM to orchestrate the entire ads flow, determining the right ad to surface at the right time based on both the user’s current turn and conversation history.
OpenAI engineering blog, 21 October 2026: How we built ChatGPT’s novel ad stack for user trust and relevance.
- The response is part of the conversation. Our test user had no history, so each conversation was one query and one response. The ads matched the response more often than the query.
- OpenAI rewrites the conversation into its own ad searches. It does this “to broaden the commercial possibilities beyond 1:1 search queries”. That fits monitor and handyman ads under queries that never asked for them.
Samsung’s ads echo the response
| The picture technology in Samsung’s ad also appears in | Share of its 144 TV ads that show one | If ads were placed at random |
|---|---|---|
| The query | 10.4% | 2.7% |
| ChatGPT’s searches | 18.1% | 5.3% |
| The response | 38.9% | 22.1% |
Picture technology means OLED, Neo QLED, Mini LED, QLED, Crystal UHD or The Frame, as written in the ad.
- The response carries the strongest signal. 38.9%, against 22.1% by chance.
- Add screen size and the pattern sharpens. Ask for a size and the ad shows it 53% of the time (section 6). Samsung’s ads look matched to the details of the conversation.
What each advertiser’s hints look like
| Advertiser | Responses with its ad | What stands out under its ads | Our reading of its hint |
|---|---|---|---|
| Kogan | 336 | No word stands out | As wide as “TVs” |
| Samsung | 160 | No word stands out. The picture technology echoes the response (above) | Product by product |
| Finder | 46 | ”streaming” in 41.3% of queries (3.2% elsewhere); “netflix” in 19.6% of ChatGPT’s searches (0.5%); “energy” in 15.2% of queries (2.3%) | Streaming and home energy |
| Scorptec | 19 | ”hdmi” in 36.8% of queries (5.2%); “cable” 26.3% (1.3%); “projector” 21.1% (1.6%) | Cables and projectors |
| Gainsville Furniture | 18 | ”home” in 16.7% of queries (3.4%); “mount” 16.7% (4.0%) | TVs in the living room (weak) |
| Centre Com | 11 | ”hdmi” in 54.5% of queries (5.2%); “cable” 27.3% (1.5%) | HDMI cables |
| Capterra | 11 | No word stands out | Unclear |
| Econnex | 10 | ”energy” in 80.0% of queries (2.1%) | TV energy use |
| Airtasker | 9 | ”mount” in 66.7% of queries (3.7%); “wall” 66.7% (5.0%) | Wall mounting |
| ExpressVPN | 9 | ”hdmi” in 55.6% of queries (5.3%); “cables” 33.3% (1.4%) | Unclear: a VPN under cable queries |
“Stands out” means a word is used at least three times as often under the advertiser’s ads as under all other responses. The last column is our reading, not the advertiser’s actual hint. Most rows rest on 9 to 46 responses.
- Kogan’s hint looks as wide as “TVs”. Nothing stands out under its 337 ads.
- Small advertisers look narrow and literal. Airtasker: wall mounts. Econnex: energy. Centre Com and Scorptec: HDMI cables.
- Finder follows streaming, not broadband. ChatGPT’s searches under its ads mention Netflix 19.6% of the time. Elsewhere: 0.5%.
- Some make no sense from outside. ExpressVPN sits under HDMI cable queries.
We cannot see how ads are matched. These are patterns in where they landed on one day.
Where the numbers come from
What we analysed. 49,692 ChatGPT responses to TV queries in Australia, August 2026. Ads were recorded on 1,239 of them. Every figure in this report comes from those 1,239, except OpenAI’s usage data. The 1,239 closely match the full set in query type and topic.
A brand name that appears only as the label on a source link is not counted as a mention. Australian usage figures come from OpenAI Signals (August 2026 release, openai.com/signals/data), used under the Creative Commons Attribution 4.0 licence; we averaged its monthly shares by quarter.
See where your brand stands
ChatGPT now decides who gets mentioned, who gets a product card, and who gets advertised beneath the answer. These are three different contests. A brand can win one and lose the others.
Somantra tracks all three across ChatGPT, Google AI Overviews, Claude and Perplexity: whether the answer recommends you over rivals, how your brand shows up at every stage of the buyer’s conversation, and where ads sit beneath the answers in your category.
Get a free brand audit to see where your brand is mentioned, chosen, and advertised against in AI search.

About the author
Arun Prasad
Founder, Somantra
Arun Prasad is the founder of Somantra, an AI search visibility platform for brands, where he writes about answer engine optimisation (AEO) and AI search. His research analyses how brands surface in AI answers across ChatGPT and Google AI Overviews, including Somantra's studies of the Australian insurance market. He focuses on measuring brand visibility through systematic, large-scale conversational testing rather than one-off screenshots.

About the author
Yajat S
Yajat S is a researcher at Somantra, where he analyses how brands surface in AI search across ChatGPT and Google. He authored Somantra's Australian insurance citation study covering 2.4 million AI search citations, focused on the content formats and URL patterns that get cited by answer engines.